


Executive Summary
The following entities updated their queue data this period: PJM, ERCOT, Tucson Electric Power, Public Service Company of New Mexico, SPP, MISO, Southern Company, Black Hills Colorado Electric, Avista, CAISO, and Dominion South Carolina.
Additions: 223.05 GW (775 projects)
PJM: 206.10 GW across 715 active requests, or 92.4% of everything added nationally this period. All of the PJM new entries are from their first cycle under their post-FERC Order 2023 reformed interconnection process.
ERCOT: 8.34 GW.
Non-CAISO West: 7.29 GW.
SPP: 1.15 GW; MISO: 100 MW; Southeast: 74.9 MW.
By technology, gas led the way at roughly 107 GW nationally, followed by battery at 65 GW, nuclear at 18 GW, and solar at 17 GW.
Withdrawals: 4.36 GW (24 projects)
National withdrawals down 73.7% relative to the previous two-week period.
West: 1.99 GW across 10 Public Service Company of New Mexico projects.
ERCOT: 1.96 GW across 10 projects.
CAISO: 250 MW, a single project and a reprieve from the substantial Cluster 15 queue attrition observed over the last month.
Storage in some form appeared in 83.6% of withdrawn queue capacity.
Other Activity:
17 projects executed GIAs totaling 3.12 GW, down 10.4% from the previous period. Median wait from queue entry to executed agreement was 2.55 years, down from 3.4 years last period.
19 projects reached commercial operation totaling 2.30 GW, up 9.9%. Median wait from queue entry to COD was 4.68 years for these projects.
In the News
Texas Governor Greg Abbott ordered the PUCT and ERCOT to audit every data center seeking to connect to the grid on August 3rd, halting approvals until those reviews are complete. Developers will have to disclose the tax incentives they receive, their power and water use, cooling operations, and facility ownership. If any project fails to comply with the audit, they will be denied interconnection.
RWE reached a $1.22 billion settlement with the Department of the Interior on August 6th, relinquishing its offshore wind leases in New York, California, and Louisiana. The capital is being redeployed into gas and LNG, including a $900 million stake in the Louisiana LNG project. The reallocation from renewables to gas tracks what we have observed in the queue over the last year.
Activity Map
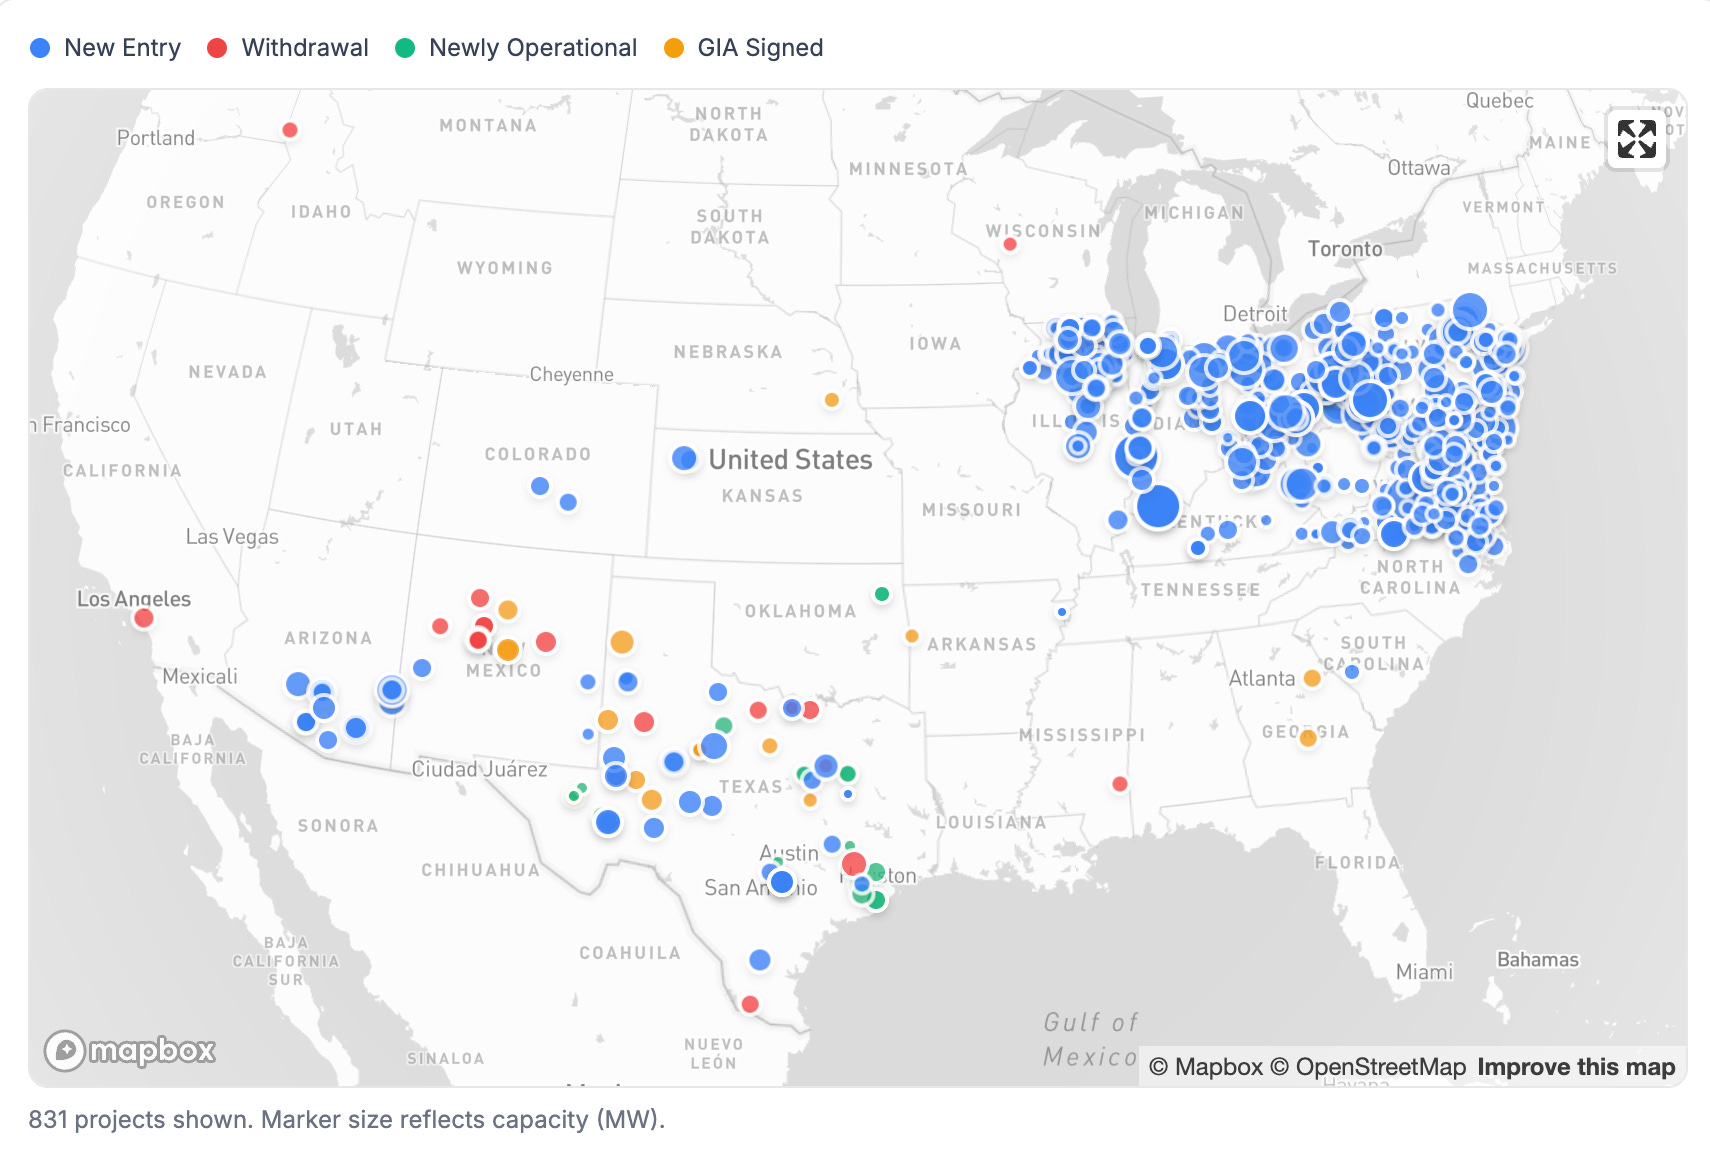
At GridTracker, we have been waiting for PJM’s release of interconnection queue data for the first cycle of its reformed process since PJM announced it in late April. The requests cover the entirety of the PJM footprint, spanning twelve states.
Virginia has the highest project count in the cohort at 184 active requests totaling 37.33 GW. Dominion’s zone accounts for 155 of those requests and 29.73 GW, or 84% by count and 80% by capacity. That concentration is expected given load growth in the region, likely driven in part by the ongoing data center buildout. Pennsylvania leads on capacity at 40.34 GW across 83 requests, followed by Ohio at 38.94 GW across 103. Indiana carries 25.38 GW across only 50 requests, an average of 508 MW per request, the largest average project size of any state in the PJM cohort.
Outside PJM, activity was comparatively light this period. ERCOT saw its usual mix of entries, withdrawals, and newly operational projects, adding 8.34 GW while withdrawing 1.96 GW, and accounting for 16 of the 19 projects that reached commercial operation this period. In the Southwest, Public Service Company of New Mexico posted a small update of 10 withdrawals totaling 1.99 GW alongside three executed GIAs totaling 900 MW. Tucson Electric Power added 6.94 GW across 17 requests, 16 in Arizona and one in New Mexico, all filed between January and March of this year.
Queue Activity
Data from PJM’s first reformed queue cycle means that new entries this period outpace anything we’ve seen so far this year, just over 223 GW of new queue additions between July 25th and Aug 6th, compared to a previous high of roughly 60 GW back in the first half of June. Withdrawals fell 73.7% to 4.36 GW compared to last period, yielding a net addition to the queues of 218.69 GW.
Gas led new additions at 103 GW, more than the next three technologies combined. Battery followed at 65 GW, then nuclear at 18 GW and solar at 17 GW. Wind and hybrid configurations trail well behind. In terms of withdrawals, the composition is unchanged from prior periods. Battery led at 2 GW across 13 projects, followed by solar+battery at 970 MW across 5, solar at 432 MW, wind+battery at 300 MW, and wind at 282 MW.
17 projects (3.12 GW) executed a GIA this period. ERCOT accounted for 9 of these projects (1.49 GW). For those nine GIA-executed ERCOT projects, the median duration from queue entry to GIA execution of 2.55 years. It is the shortest queue entry to IA execution duration we have observed in recent periods, though ERCOT has historically moved projects to executed agreements faster than other jurisdictions.
ERCOT also accounted for 16 of the 19 projects that came online over the last two weeks (2.06 GW of the 2.30 GW total). New operational capacity was split roughly evenly between standalone batteries at 1,188 MW across 11 projects and solar at 1,104 MW across 7, with a single 9.9 MW gas project making up the balance.

Queue Snapshot — Current State
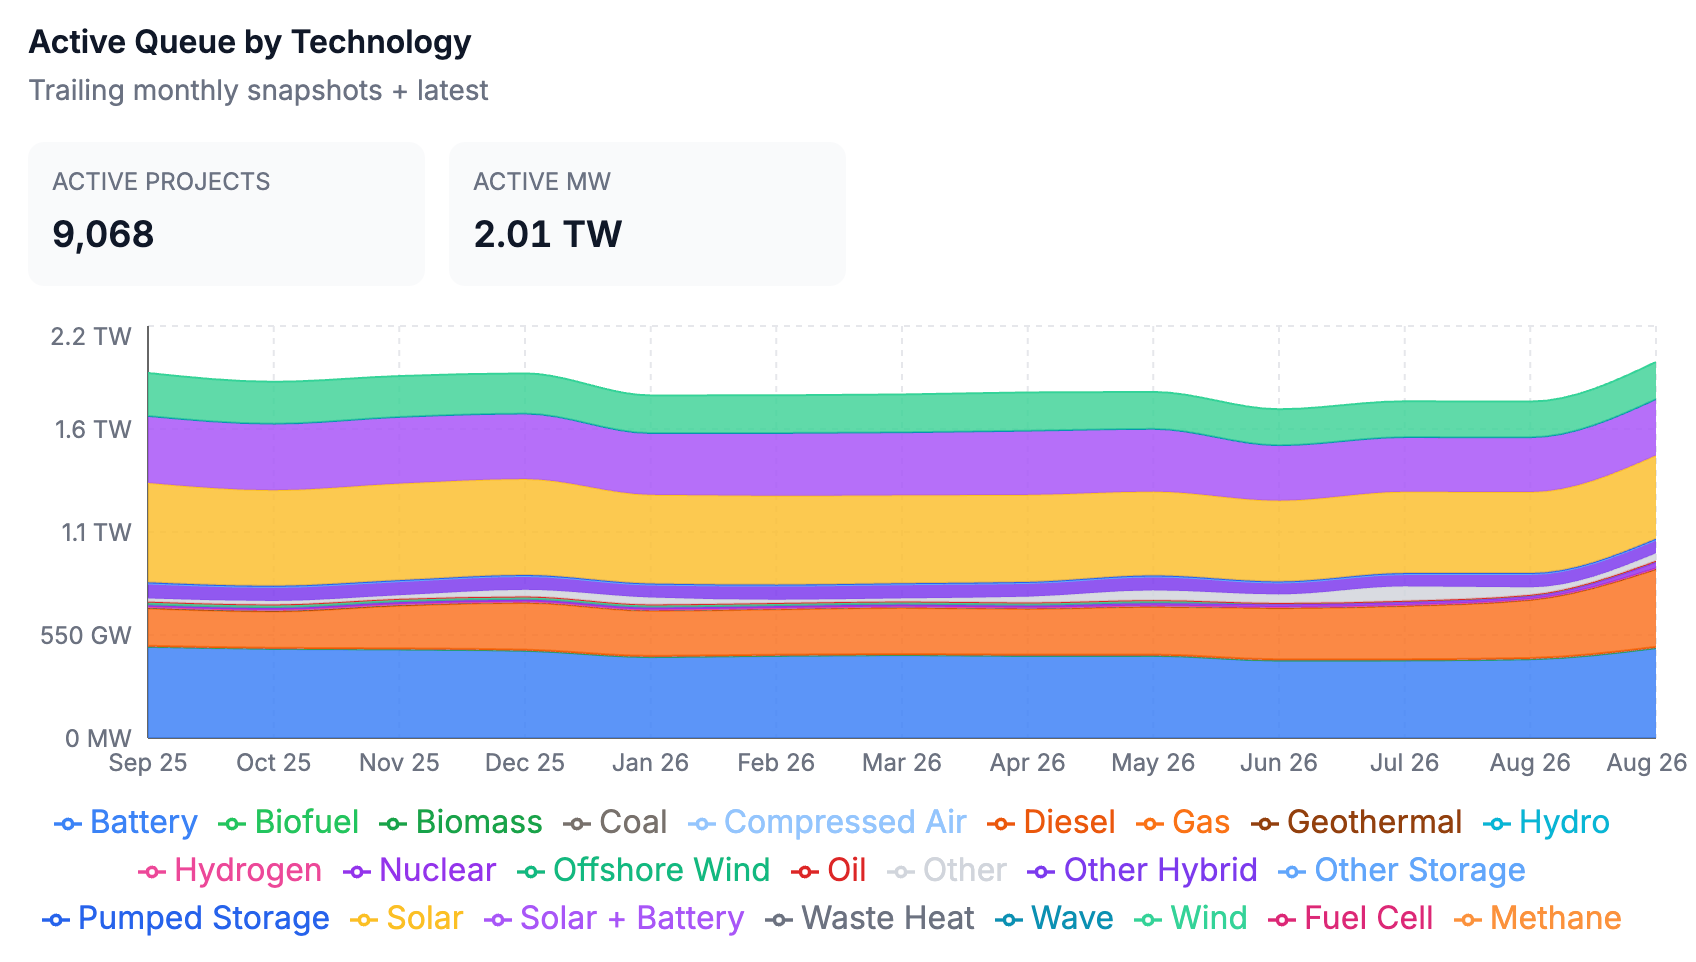
The 2 TW threshold for active queue capacity is largely arbitrary, though it has been a useful gut check for the size of the queue over the last couple of years as process reforms have taken effect across ISOs and utilities. With PJM’s first reformed cycle (C01) now reflected in the data, we are back to over that threshold at 2.01 TW of active queue capacity across 9,068 projects, up from 1.79 TW across 8,335 projects last period.
Gas now stands at 412 GW, up 108.1% year over year and up 107 GW from last period alone. PJM accounts for 109 GW of that total, or roughly a quarter of the national gas queue, and almost all of the active PJM gas capacity is from the C01 cluster. Nuclear tells a similar story in a smaller frame. It stands at 32.26 GW, up 269.0% year over year, the largest percentage increase of any technology we track. PJM accounts for 19.29 GW of that, roughly 60% of the national nuclear queue, and about three quarters of the year over year increase arrived in this period.
The renewable side of the queue continues to move the other way. Solar is down 16.1% to 445.37 GW, solar+battery hybrids are down 16.1% to 300.26 GW, wind is down 13.4% to 198.55 GW, and offshore wind is down 62.9% to 6.86 GW. Battery is close to flat at 479.08 GW, down 1.4% year over year, and is now the single largest technology in the queue.
The overall composition of the queue remains largely unchanged. Five technologies account for roughly 91% of the 2.01 TW total: battery at 479.08 GW, solar at 445.37 GW, gas at 412.31 GW, solar+battery at 300.26 GW, and wind at 198.55 GW. Storage in some form accounts for roughly 786 GW, or about 39% of everything in the queue.
The ordering of the major resource types represented in the queue is starting to change. Last period solar led at 432 GW with gas at 306 GW, a gap of roughly 126 GW. Battery has since passed solar, and gas now sits 33 GW behind it. If gas continues to enter the queue at anything close to its recent rate, it will account for the largest share of capacity in the national interconnection queue within the year.
Regional Breakdown by ISO/RTO
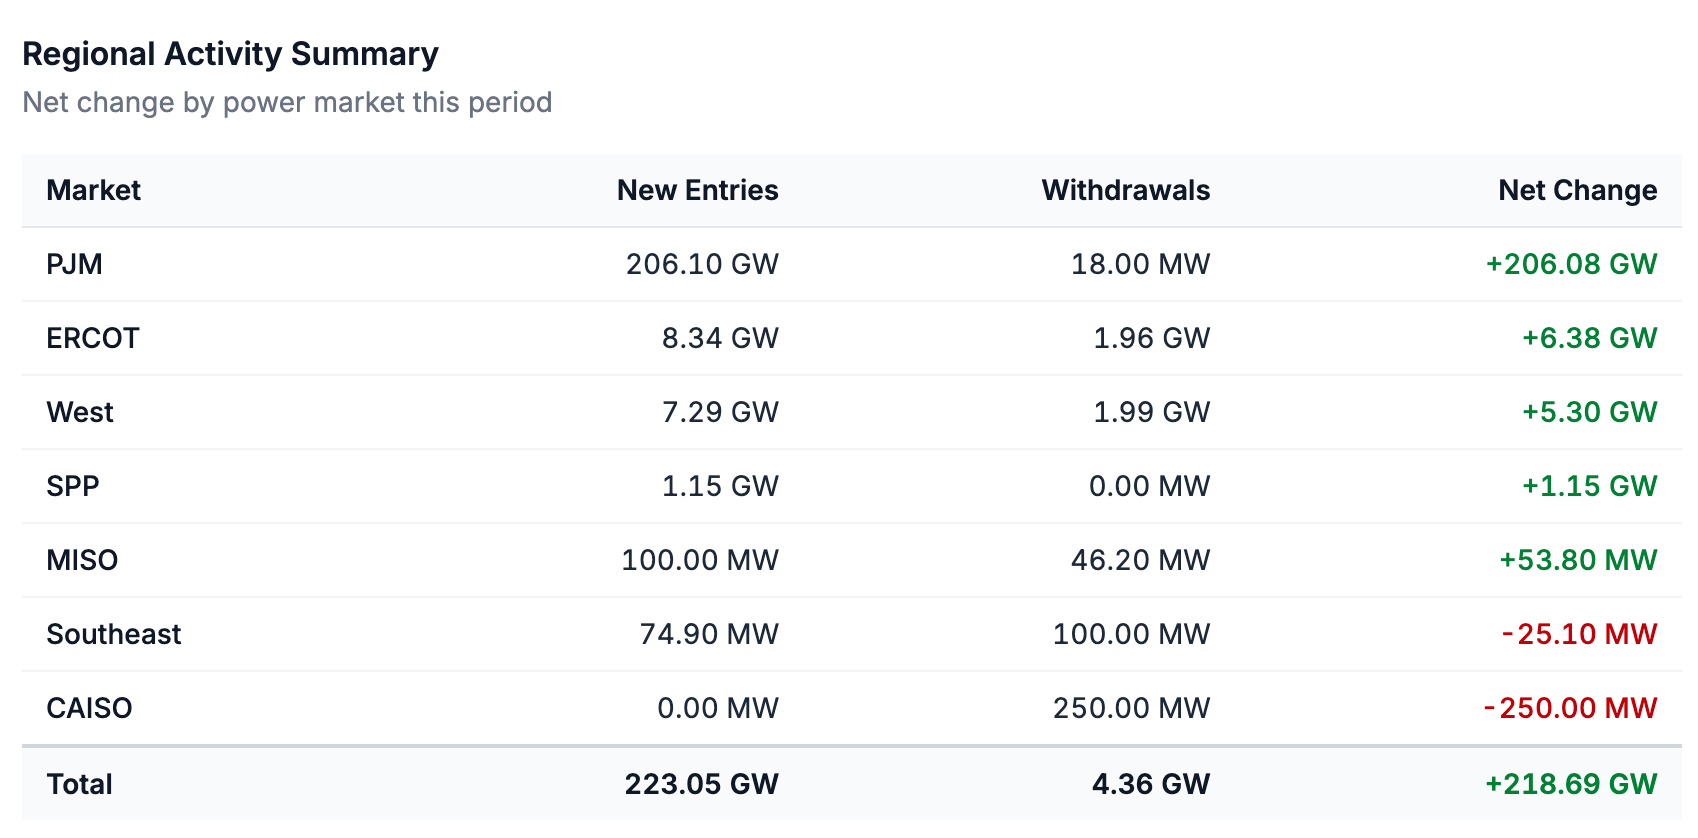
Outside of PJM, this was one of the quieter periods we have tracked in recent months. Net of withdrawals, ERCOT added 6.38 GW, the non-ISO West added 5.30 GW, SPP added 1.15 GW, and MISO and the Southeast were effectively flat at plus 53.8 MW and minus 25.1 MW respectively. After shedding roughly 11.6 GW of Cluster 15 capacity across the two prior editions, CAISO recorded only a single 250 MW withdrawal this period.
PJM’s active queue went from 76.36 GW to 282.46 GW with the addition of the C01 requests, an increase of 270%, and surpassed the Southeast, SPP, and CAISO in terms of total active capacity. PJM now trails only the non-ISO West at 484 GW, ERCOT at 440 GW, and MISO at 358 GW. The C01 cluster alone accounts for 73% of PJM’s active queue by capacity, against 45 GW still held in the legacy TC1 and TC2 transition clusters and 31 GW in the pre-transition serial queue.
As published, C01 contains 816 requests totaling 226 GW, of which 715 requests and 206 GW remain active.
The composition of C01 is close to an inversion of PJM’s last transition cluster. Of the 31 GW still active in TC2, solar accounts for 38.4%, gas for 26.3% including hybrid configurations, battery for 22.0%, solar+battery for 6.6%, nuclear for 4.8%, and wind for 1.6%. Solar went from the largest technology in the prior cluster to the fourth largest in this one, and its share fell by a factor of six. Gas roughly doubled its share. Nuclear went from a small percentage of the previous transitional cluster to the third largest technology in the cohort.
The capacity of new PJM queue requests is also far larger. Gas requests in C01 average 675 MW and nuclear requests average 710 MW (includes uprates), against a cohort-wide average of 288 MW and average request sizes of 109 MW for solar and 107 MW for wind. There are 42 requests of 1 GW or larger in PJMS C01, which carry nearly a third of the cohort’s capacity on their own.
Geographically, the cohort concentrates in two transmission owners. AEP accounts for 152 requests and 60.04 GW, and Dominion has 177 requests and 35.93 GW. In total, AEP and Dominion represent 46.6% of the cohort’s requested capacity. ComEd follows at 107 requests and 22.27 GW, then ATSI at 18.07 GW and Alleghany Power at 17.13 GW. Gas requests in PJM C01 are also geographically concentrated. Pennsylvania and Ohio hold 61.87 GW of the 99.95 GW of gas in the cycle (61.9%) with West Virginia, Indiana, and Virginia holding roughly 8.5 to 9.5 GW each.
It is always important to remember that the majority of queue requests ultimately do not get built, and even those that do reach commercial operation historically take years to come online. In PJM C01, proposed commercial operation dates cluster in 2030 and 2031, which together account for 376 requests and 122.95 GW, or 59.7% of the cohort. Near-term proposed CODs are comparatively less common: 3.68 GW proposes 2026, 1.30 GW proposes 2027, 10.85 GW proposes 2028, and 24.09 GW proposes 2029.
As discussed in the previous GridTracker Insights edition, PJM’s 2028/29 capacity auction cleared at the $325/MW-day cap for a third consecutive year and fell 6,831 MW short of the reliability requirement while clearing just 525 MW of new generation and uprates. Even if every 2028 request in C01 were built on schedule, which will not happen, it would arrive after the delivery year the auction has already priced.
Of the initial 816 requests published in this first reformed PJM queue cycle, 101 (19.44 GW) already withdrew by the time PJM published their data. That is 12.4% of requests and 8.6% of capacity gone before receiving initial study results. Batteries led pre-publication exits at 7.68 GW across 39 requests, followed by gas at 4.88 GW across 10 and solar at 2.63 GW across 19. Looking at PJM’s previous transition clusters as a benchmark, TC2 has lost 369 requests and 48.73 GW to withdrawal against the 278 requests and 31.12 GW still active, an attrition rate of over 60% by capacity. Applying that rate to C01 puts the surviving cohort around 80 GW, compared to the 206 GW that entered. That is still a substantial amount of new capacity seeking interconnection in PJM, but it is substantially less than the current headline GW figure for PJM C01.
Notable Projects
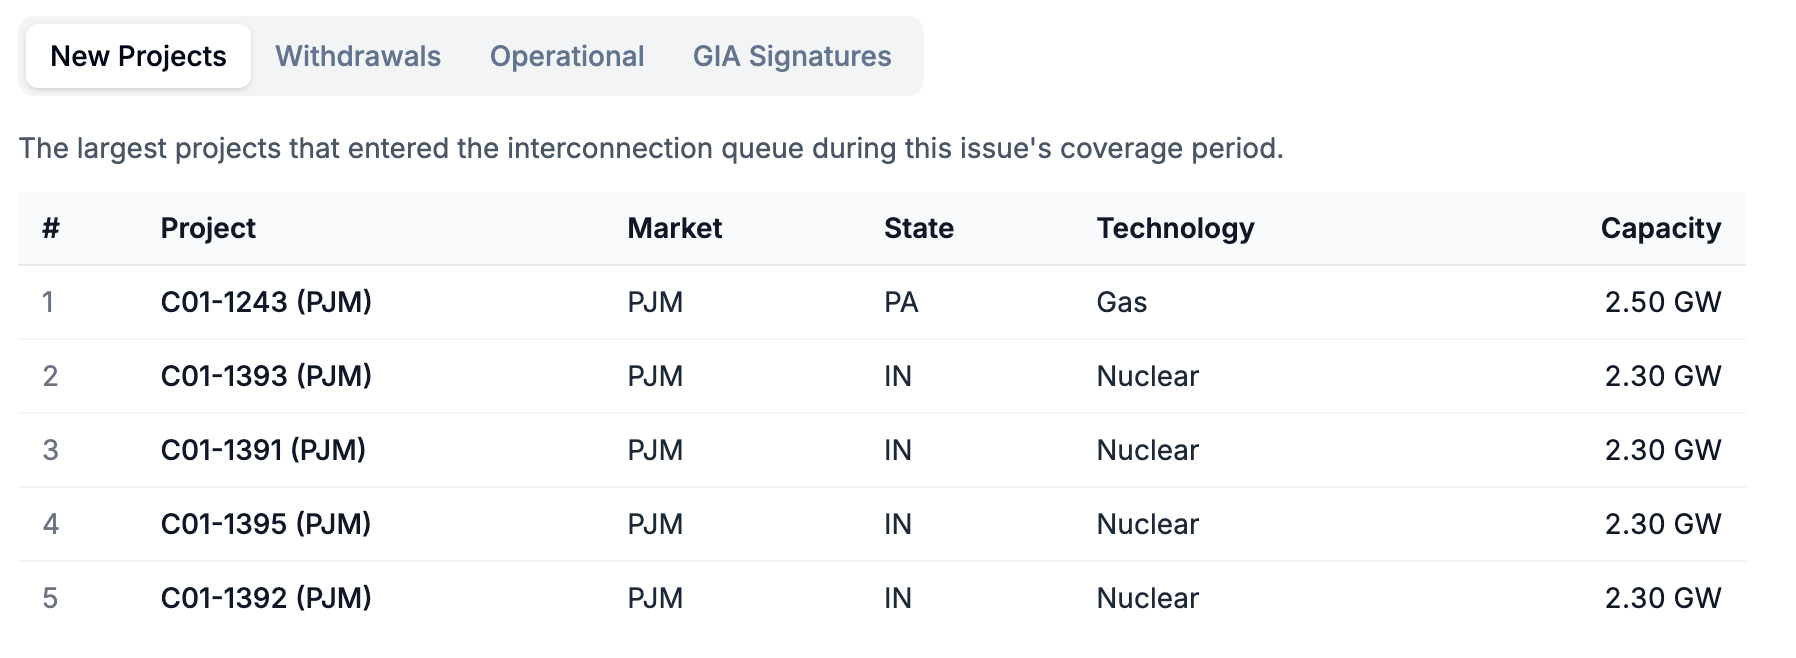
The PJM C01 records show what entities filed which requests. The largest nuclear filings belong to AEP and its associated entities. Indiana Michigan Power Co. filed five requests of 2,300 MW each, three in Spencer County at Rockport-Jefferson 765 kV and two in Sullivan County at Sullivan 765 kV, staged one year apart from 2033 to 2035. Appalachian Power filed a sixth in Campbell County, Virginia. That is 13.8 GW, or 78% of all nuclear capacity requested in C01. These are more likely different phases of two nuclear plants rather than five separate nuclear power plants.
There are also 13 requests totaling 1.37 GW that are uprates at existing nuclear plants, ranging from 5.7 MW to 382 MW. Six from Constellation and four from Vistra. Six of the thirteen proposed in-service dates of 2028 or earlier. None of AEP’s six nuclear requests propose anything before 2033.
In the PJM C01 cycle, we are seeing some evidence of redevelopment at retired coal plants to take advantage of existing interconnection rights and capacity. The largest gas request in C01 is 2,500 MW in Beaver County, Pennsylvania at Bruce Mansfield 345 kV, filed by Shippingport Power Station, LLC for November 2028. Bruce Mansfield was a 2,741 MW coal station that retired in 2019. Three more gas requests sit on adjacent points of interconnection, bringing roughly 5.9 GW to that one node. The same is happening at Homer City, an 1,884 MW coal station in Indiana County, Pennsylvania that retired in 2023, where two gas projects (1,736 MW and 780 MW) both requested service at the retired plant’s 345 kV and 230 kV interconnections.
Cortex Sycamore, LLC, the largest filer in C01 with 25 requests, submitted 10 nearly-identical gas requests at exactly 976 MW in pairs across five different points of interconnection in Ohio and Indiana. Dominion filed both of its 1,694 MW gas requests along the Cunningham-Elmont line and both of its 1,530 MW gas requests at Mount Storm-Valley.
It is always interesting to check how long projects actually take to move through the interconnection process and come online as we see newly operational projects in the data. The 19 projects that reached commercial operation this period waited a median of 4.68 years. On the high-end of the distribution, a 72.5 MW solar project in Mayes County, OK reached commercial operation on August 3rd after entering the SPP queue in May 2017, a queue duration of 9.2 years.
Want to go deeper? GridTracker users get access to:
Project-level insights (see the project-level changes that occur in real-time)
Exportable datasets (export the full list of newly operational, withdrawn, GIA-signed, and added projects)
Interactive graphs and visualizations
Custom dashboards with real-time alerts and data export
Exclusive in-depth industry reports
… and much more!