


Executive Summary
The following entities updated their queue data this period: BPA, PacifiCorp, LADWP, NV Energy, Tucson Electric, Salt River Project, APS, CAISO, SPP, MISO, Duke, and Georgia Transmission.
Additions: 7.96 GW (72 projects)
MISO: 3.40 GW across 8 projects, driven by Entergy Arkansas, Entergy Texas, and Duke Energy Indiana.
SPP: 2.35 GW across 40 projects. Highest project count of any market, lowest average project size (roughly 59 MW).
Southeast: 1.39 GW across 18 projects, mostly Duke surplus interconnection requests and new Georgia Transmission solar+storage entries.
Battery led new entries at 3.26 GW, followed by “Other” at 1.66 GW, gas at 1.29 GW, solar+battery at 810 MW, standalone solar at 573 MW, and wind at 367 MW.
Surplus interconnection requests accounted for 17 of the 72 projects added and 1.76 GW, roughly 22% of added capacity.
Withdrawals: 16.54 GW (67 projects)
Non-ISO West: 11.60 GW, the largest single-market withdrawal figure of the year so far.
CAISO: 4.16 GW, a continuation of the Cluster 15 exits.
Solar+battery hybrids led at roughly 8.3 GW, followed by standalone batteries at 4.0 GW, wind at 2.0 GW, gas at 1.5 GW, and solar at 1.1 GW. Storage in some form was represented in more than three quarters of withdrawn capacity.
On the Docket
Texas PUCT
Crusoe/Goodnight Co-location, Final Order (Docket No. 59220)
The PUCT signed a final order on July 24 approving the net metering arrangement for Crusoe Two, a second 260 MW data center behind the Goodnight Wind POI, and imposed the same six conditions from Docket 58881. Crusoe and Ensign’s main objection related to the curtailment requirement, which would apply to both loads and shed 525.5 MW of demand to protect a wind facility that generates at most 265.5 MW. The Commission rejected the argument, reasoning that because both loads net against the same generator behind a single point of interconnection, curtailing only one would not achieve the objective of keeping the wind facility’s capacity available to the grid during emergencies.
Notably, the order also retains a provision that requires the data center to curtail upon ERCOT instruction while barring it from being compensated for doing so, since the load cannot be offered into any ERCOT or utility demand response program.
(Note: Deep-dive on this facility’s permitting and interconnection history available for free here)
Large Load Customer Tariffs Rulemaking (Project No. 58000)
Earlier this month, the Commission issued a set of proposed rules implementing Senate Bill 6, which would be the first codified standards for how large loads connect and pay in ERCOT. At the center of the rules is a 20-year minimum take obligation. A large load customer would owe 240 consecutive monthly payments based on the greater of its contracted peak demand or its actual demand, and billing would start once transmission capacity is made available whether or not the site has energized. The proposal also ends cost socialization for new agreements, barring utilities from recovering large-load interconnection costs through general transmission rates.
The open question is whether Texas creates a separate rate class for what the proposal calls “large computational load,” meaning a site where at least half of demand comes from computing equipment. The Commission asked parties for legal support on whether it can lawfully draw that distinction. Comments are due August 11.
the cleanest test yet of who absorbs the asset when the anchor customer’s obligation ends.
Virginia
Governor’s Energy Office Asks for Large-Load Cluster Studies (Case No. PUR-2026-00056)
Virginia’s Chief Energy Officer intervened on July 9 in Dominion’s transmission rate case. The Governor’s Office wants the SCC to “transition from sequential interconnection studies to a proactive Cluster Study Approach for large-load connection requests,” describing it as “a direct application of the same logic of FERC Order No. 2023 that requires cluster studies for new generation interconnections.” It also asks the Commission to require Dominion to apply a rigorous “but for” test, meaning that any network or substation upgrade the utility would not have built absent a specific large load would be charged directly to that customer rather than spread across all ratepayers.
For context on this docket, Dominion’s investment in transmission assets grew 56.2% between 2020 and 2025, from roughly $10 billion to $15 billion, and nearly two thirds of that growth came from its largest commercial and industrial customers (e.g., data centers). Google’s testimony in this case estimates Dominion would need roughly 233 substations to interconnect the 70 GW currently in its large-load queue.
In the News
PJM’s 2028/29 capacity auction cleared at the $325/MW-day price cap for the third consecutive year, procuring 138,318 MW but falling 6,831 MW short of the reliability requirement. Three years of maximum prices produced almost no new supply, with just 525 MW of new generation and uprates clearing, down from 774 MW a year earlier. The auction procures for delivery in 2028, and between interconnection timelines, network upgrade costs, and equipment lead times, very little can move from the queue to commercial operation on that timeline. PJM’s market monitor separately attributed $6.3 billion of the $16.4 billion in auction charges to data centers and proposed a separate capacity auction for that load.
MISO will develop a dedicated expedited study process for large loads and their dedicated generation, run separately from the generator interconnection queue, alongside a non-firm transmission service option. Announced on July 20th, it is one of the first responses to FERC’s show cause orders to all six RTOs and ISOs.
New York imposed a statewide moratorium on new hyperscale data centers on July 14th, pausing discretionary state environmental permits for up to a year while they develop standards for data center development. Permits already deemed complete may proceed. The order follows an open “Energize NY” proceeding examining whether data centers should pay more for grid upgrades or supply their own power.
Activity Map
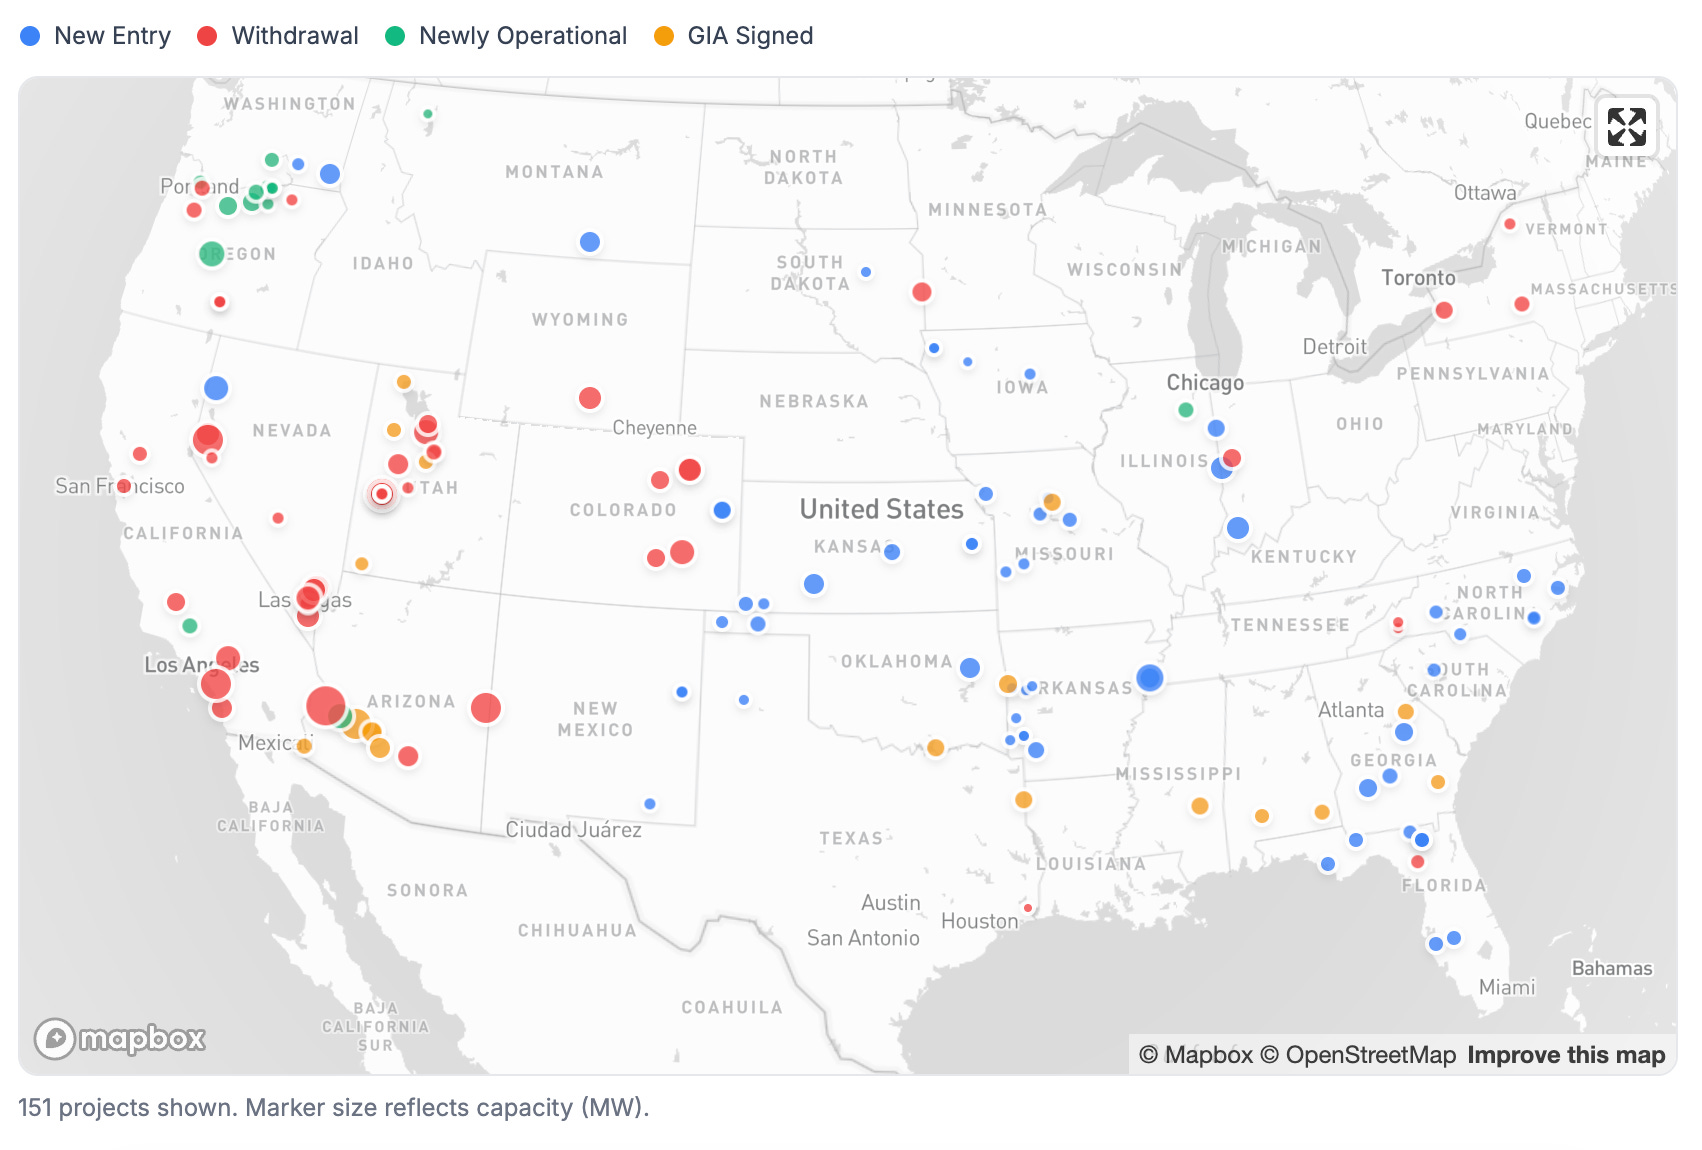
The West (the Desert Southwest and Pacific Northwest in particular) account for the bulk of activity this period, but it’s mostly capacity leaving the queue. Nevada and Utah recorded the largest exits in the West, where NV Energy cleared roughly 3.6 GW of battery and gas requests and a Los Angeles Department of Water and Power portfolio of more than 3 GW withdrew from Intermountain Power Agency’s queue (Utah). Western Arizona and California saw a further 4.16 GW of withdrawals, all of it CAISO, led by a 2.0 GW battery project in La Paz County.
There was a fair amount of newly operational activity in the Columbia River Corridor, with ten projects totaling 1.38 GW, roughly two thirds of the 2.09 GW that moved to operational status. Nearly all of it sits in Bonneville Power Administration territory across Morrow, Gilliam, Umatilla, Wasco, and Deschutes counties in Oregon and Yakima and Clark counties in Washington.
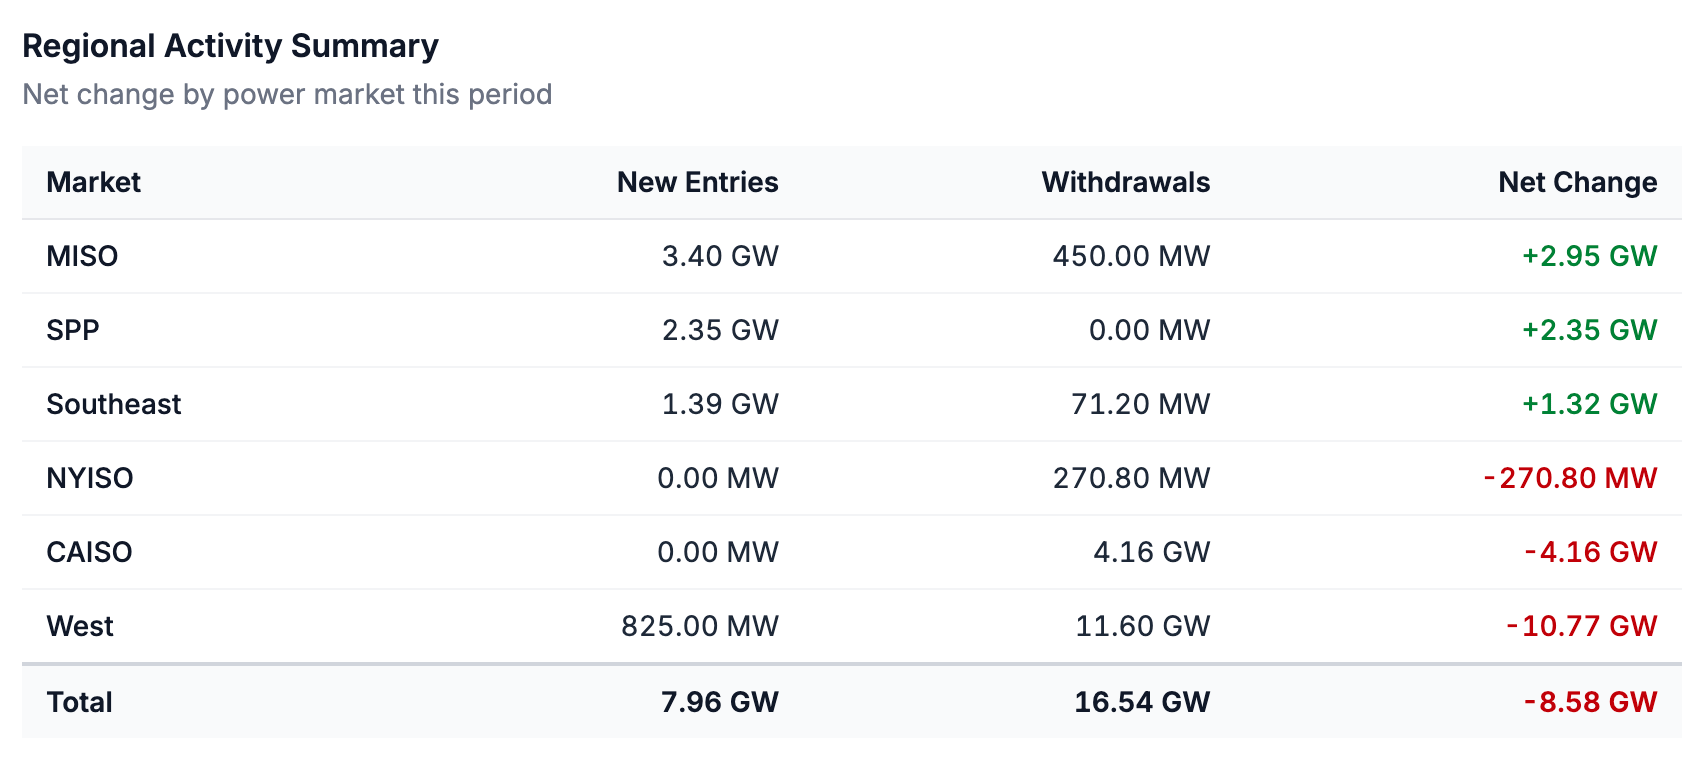
New entries came from a different set of markets. MISO led with 3.40 GW, concentrated in Entergy Arkansas, Entergy Texas, and Duke Energy Indiana, followed by 2.35 GW spread across 40, mostly small, SPP requests and 1.39 GW in the Southeast, largely Duke Energy Florida surplus additions and Georgia Transmission.
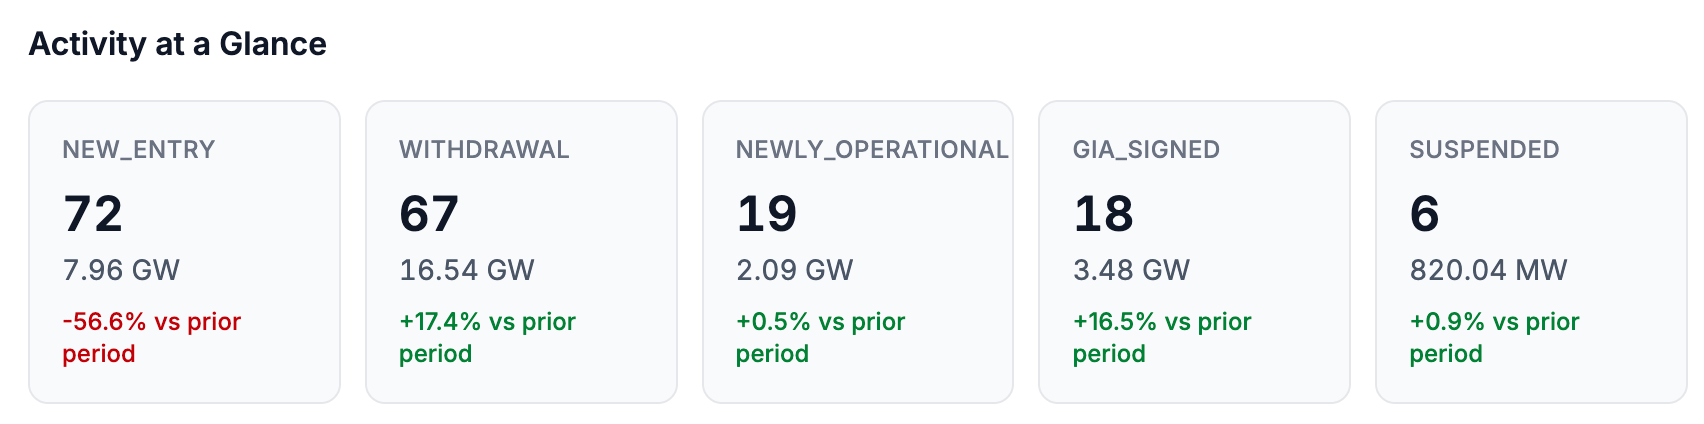
Queue Activity
Additions fell by more than half compared to last edition, dropping 56.6% to 7.96 GW while withdrawals rose 17.4% to 16.54 GW, a net reduction of 8.58 GW and the lowest two-week entry figure since the period ending February 20th. Storage dominated both queue entries and exits this period. Hybrid solar+battery projects accounted for roughly 8.3 GW of withdrawals and standalone batteries another 4.0 GW, so more than three quarters of everything that left the queue included storage. On the entry side, surplus interconnection requests accounted for 17 of the 72 new requests (1.76 GW), roughly a fifth of added capacity, including eight Duke Energy Florida battery projects and four SPP requests. PacifiCorp also executed four surplus agreements in Utah. This may be a sign that developers are looking for ways around lengthy cluster studies and the network upgrade costs that come with them by adding storage at points where interconnection service has already been secured.
A total of 3.48 GW executed GIAs across 18 projects this period, most of it in the West and most of it storage, with only about 720 MW of standalone solar in the mix. That cohort waited a median of 3.4 years between queue entry and executing a GIA. Of the 19 projects reported as newly operational (2.09 GW), only two list a commercial operation date between July 11 and July 24. The rest appear to be a Bonneville Power Administration records refresh, covering projects with proposed completion dates as far back as 2012.
Queue Snapshot — Current State
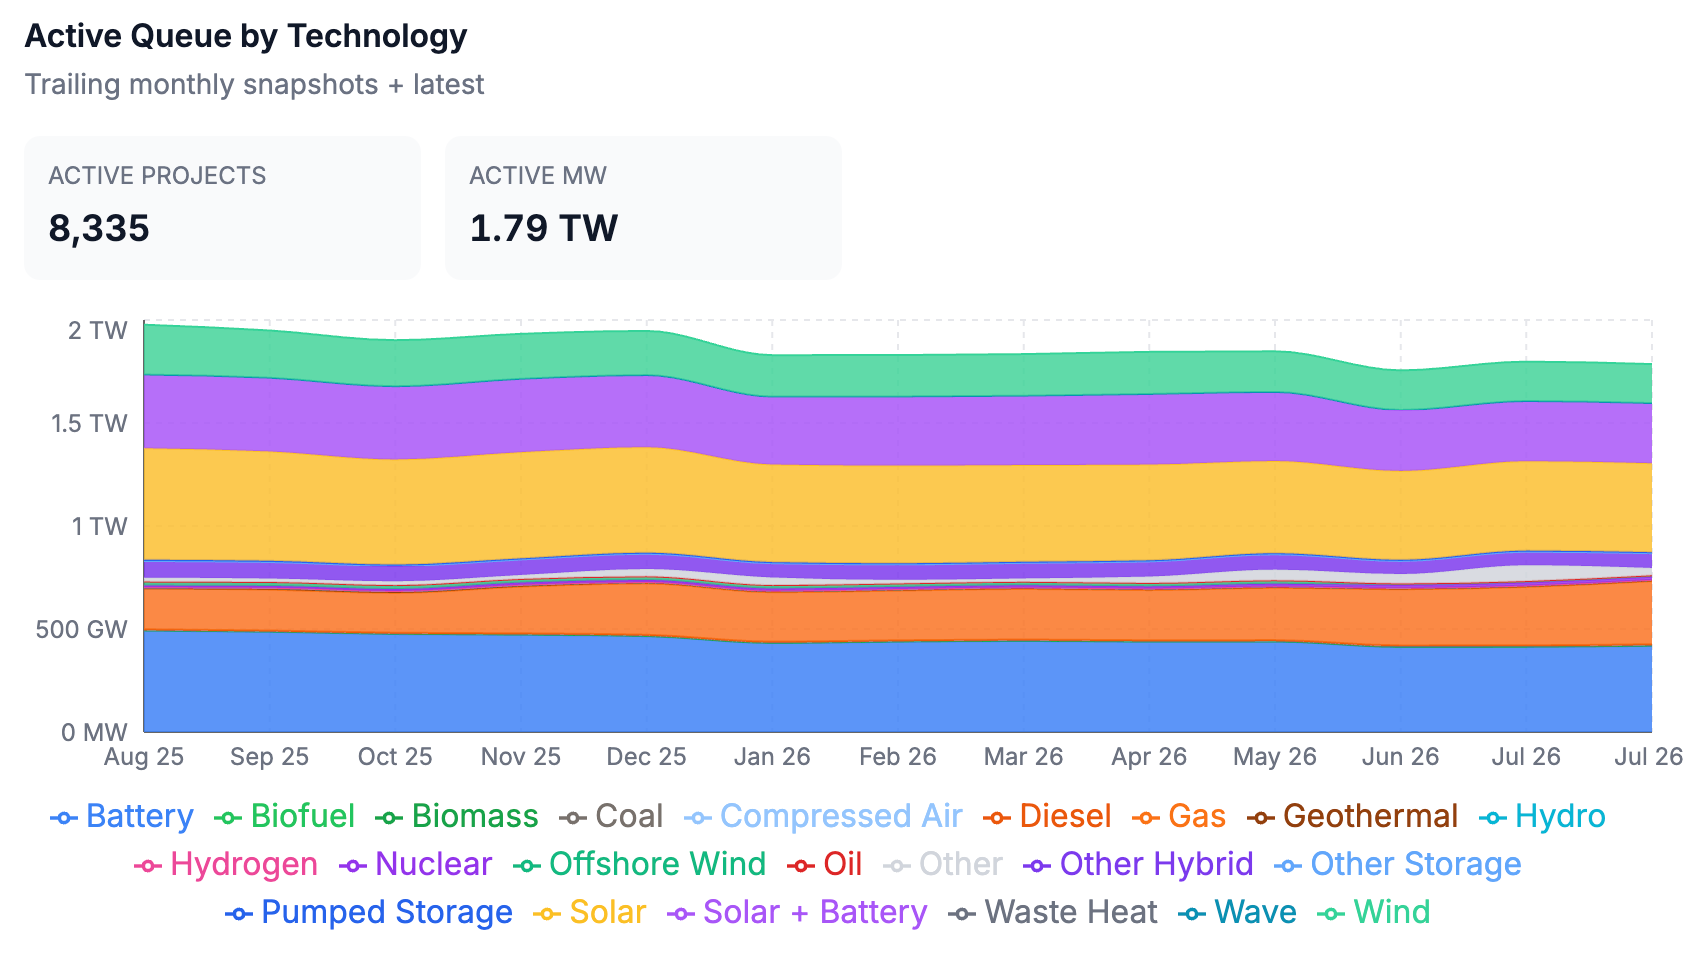
The active queue stands at 1.79 TW across 8,335 projects, down roughly 10 GW from the prior period but essentially flat on the year. What we are starting to see now is less a continuation of the contraction that followed FERC Order 2023 and the related ISO and utility queue reforms, and more a recomposition of what’s in the queue. Gas is up 54.4% year over year at 305.64 GW, and renewables continue to move the other way, with solar down 20.2%, wind down 21.8%, and battery down 15.0%.
The queue remains highly concentrated. Five technologies make up roughly 91% of the 1.79 TW total: solar at 432 GW, battery at 418 GW, gas at 306 GW, solar+battery hybrids at 292 GW, and wind at 189 GW. Storage in some form accounts for roughly 717 GW, about 40% of everything in the queue.
Regional Breakdown by ISO/RTO
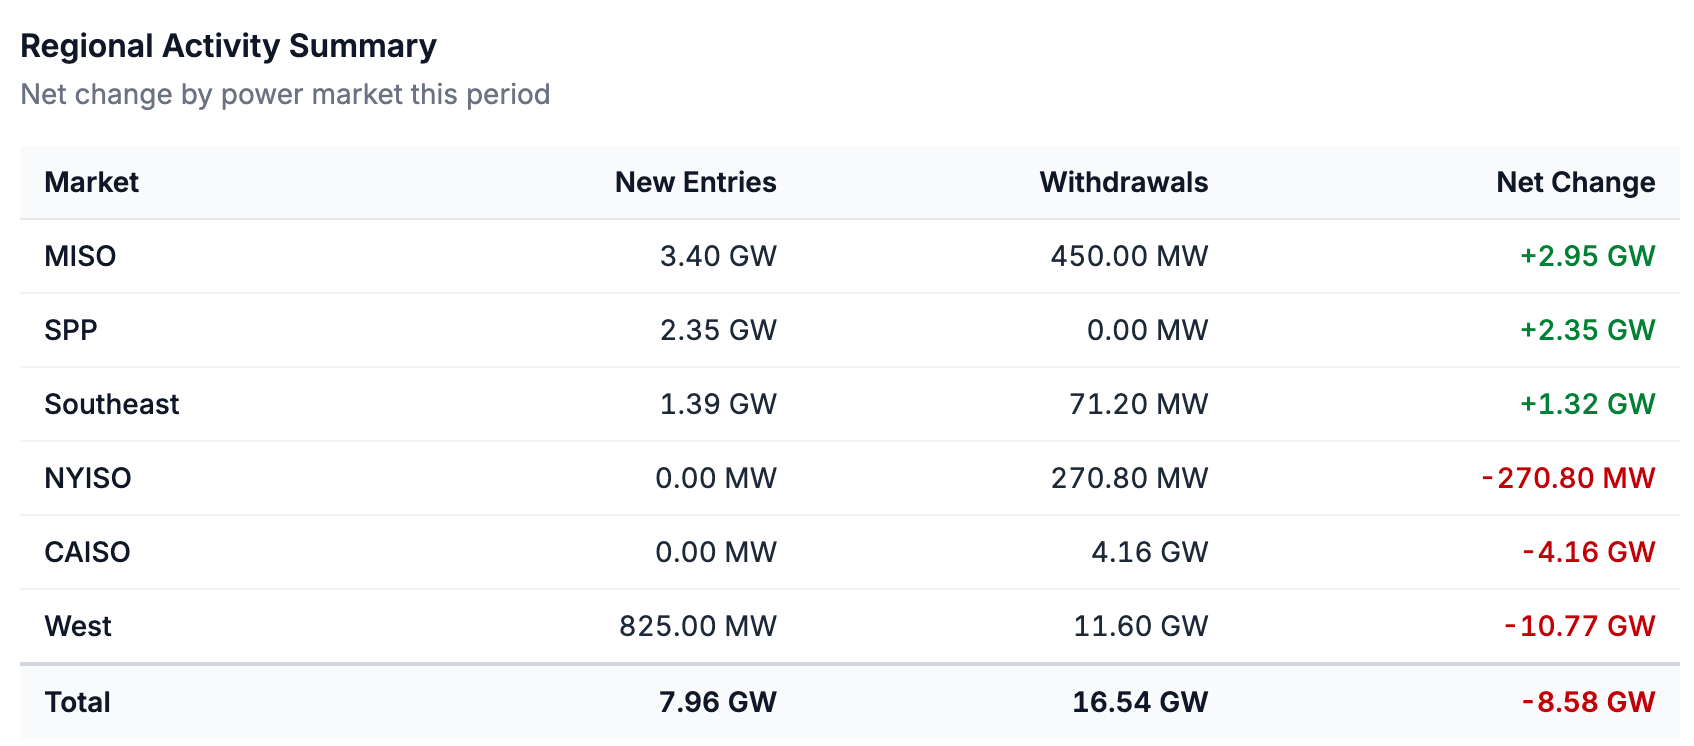
The West recorded a net decline of 10.77 GW, the largest single-market drop that we’ve tracked so far this year. Nearly all of it came from NV Energy, LADWP, Tucson Electric, and Salt River Project refreshing their queues within a two-day span. At the other end of the table, ERCOT, PJM, and ISO-NE registered no activity in either direction, which is notable given ERCOT accounted for roughly 80% of new entries in the last edition.
CAISO shed an additional 4.16 GW this period, extending the Cluster 15 attrition tracked earlier this month. Combined with the 7.44 GW flagged two weeks ago, that puts cumulative exits from the cohort at roughly 11.6 GW across two periods. CAISO’s active queue has fallen from roughly 190 GW last August to about 105 GW today, the steepest sustained decline of any market. Elsewhere activity was quieter, with MISO up 2.95 GW, SPP up 2.35 GW, and the Southeast up 1.32 GW.
Notable Projects
GridTracker’s queue data includes free-text comment fields that accompany new interconnection requests. Developers and utilities often state the purpose of a request there, providing an early signal of what is driving new capacity. Increasingly, we are seeing comments reference large loads and data centers.
In Indiana, Crosley Energy Storage, a 400 MW battery project in Pike County on a Duke Energy Indiana 345 kV line, states that it will meet “the load needs identified by Decennial Group for their 2028 projected hyperscaler data center load.” Sycamore BESS, a 400 MW battery in Vermillion County, describes itself as serving “an incremental large load located in Clark County, Indiana.” NIPSCO added a 150 MW surplus battery request in Newton County. Together, that is just under 1 GW of storage capacity entering the queue in two weeks, most of it tied to an identified load rather than proposed as a merchant asset.
There are similar dynamics at play in eastern Arkansas, where Entergy Arkansas filed DOUBLEC Energy Center 3 (750 MW combined cycle) and DOUBLEC Energy Center 4 (250 MW simple cycle) at the same West Memphis to Keo interconnection in Crittenden County, both stating that they exist to serve long term resource adequacy for new large loads in MISO’s LRZ8.
Want to go deeper? GridTracker users get access to:
Project-level insights (see the project-level changes that occur in real-time)
Exportable datasets (export the full list of newly operational, withdrawn, GIA-signed, and added projects)
Interactive graphs and visualizations
Custom dashboards with real-time alerts and data export
Exclusive in-depth industry reports
… and much more!