


Executive Summary
The following entities updated their queue data this period: PJM, MISO, SPP, CAISO, ISO-NE, Idaho Power, PacifiCorp, Puget Sound Energy, Portland General Electric, NV Energy, BPA, Public Service Co. of Colorado, PNM, Tri-State, NorthWestern Energy, Southern Company, Duke Energy Carolinas, Dominion Energy South Carolina.
Additions: 16.61 GW (71 projects)
MISO: 11.7 GW across 39 requests. 34 are DPP-2026 application-window requests (11.3 GW) without a fuel type. MISO also posted five surplus interconnection requests (400 MW).
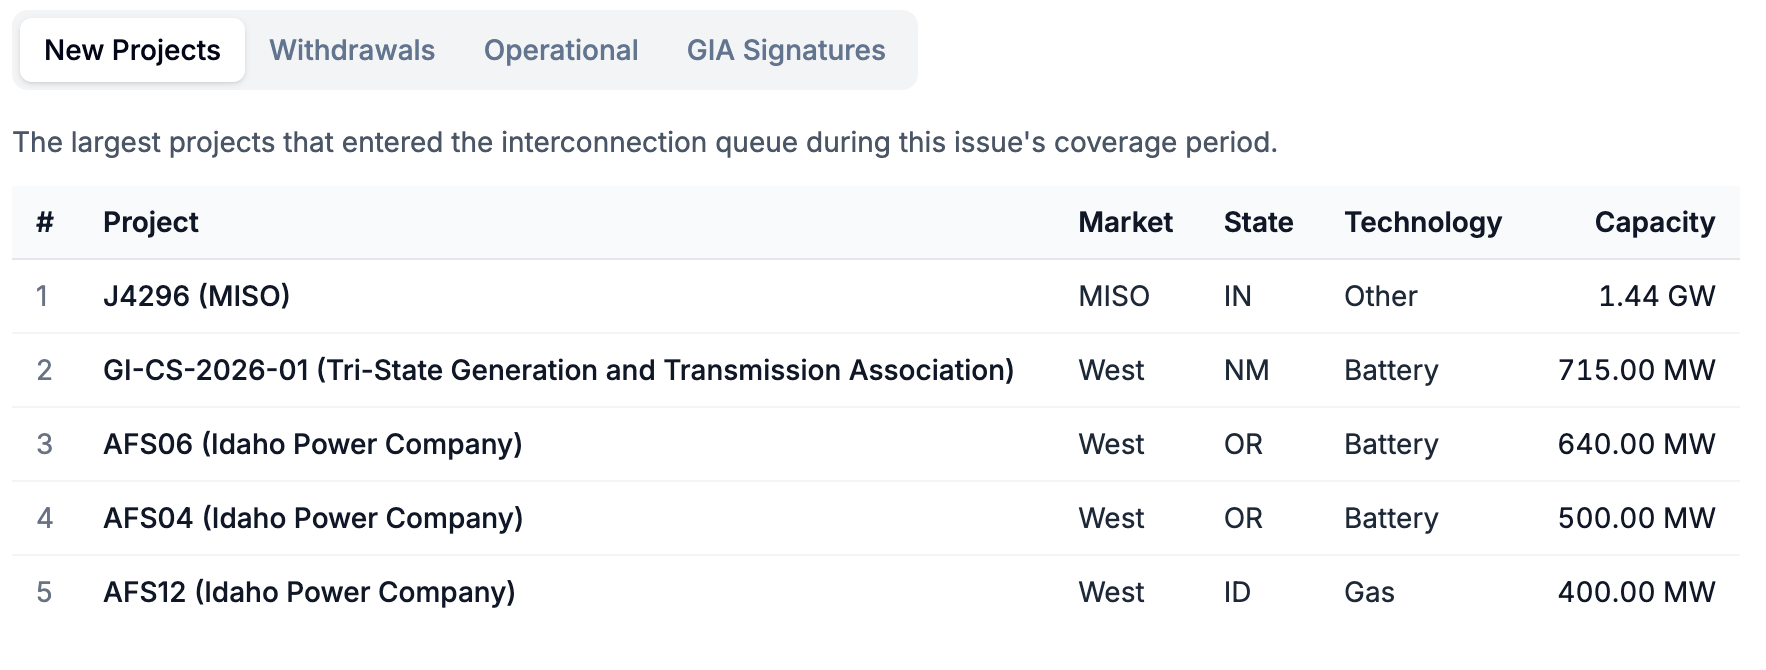
Non-CAISO West: 4.2 GW across 25 requests. About 3.4 GW of that is 12 Idaho Power affected system study records (”AFS”). These are projects already in PacifiCorp’s and Avista’s queues that Idaho Power is studying for impacts on its system, not new requests seeking to interconnect in Idaho Power.
Southeast: 360 MW; SPP: 327 MW (two surplus requests, including a 252 MW battery in Cottle County, TX).
By resource type (for requests that currently report a fuel type, excluding Idaho Power’s affected system records): solar+battery 715 MW, battery 400 MW and gas 320 MW. About 11.6 GW, nearly all of it MISO’s DPP-2026 requests, does not yet report a fuel type.
Withdrawals: 30.30 GW (164 projects)
PJM: 21.4 GW across 127 projects. Cycle 1 accounts for 15.3 GW (51 projects) and Transition Cycle (TC) 2 for 6.05 GW (75 projects).
Non-CAISO West: 6.3 GW across 18 projects. Idaho Power accounts for 2.3 GW, including two projects with executed IAs (1 GW solar+battery in Wyoming, 800 MW wind+battery in Idaho). Puget Sound Energy lost 1.8 GW and PSCo 1.4 GW.
Southeast: 2.0 GW, led by a 711 MW Duke Energy Carolinas gas request and 11 Dominion Energy South Carolina projects (1.1 GW).
SPP: 397 MW; CAISO: 120 MW; MISO: 100 MW.
By resource type: gas 8.6 GW, battery 8.4 GW, solar 6.8 GW, solar+battery 3.2 GW.
Other Activity:
GIAs: 56 projects, 14.6 GW.
Newly operational: 7 projects, 739 MW.
In the News
FERC delays PJM’s reliability backstop auction by five months. On September 29, FERC accepted PJM’s Reliability Backstop Procurement, a one-time auction for new capacity, but suspended it until February 28, 2027, while it reviews cost allocation, transmission owner exit rules, and load-serving entity collateral requirements. PJM did not open bidding on September 30 as planned and has not set a new date.
Texas pauses state permits for data centers. As we covered in the last issue, on September 21, Gov. Abbott directed the Texas Commission on Environmental Quality (TCEQ) to stop issuing permits for data center projects until state audits of their effects on the grid, ratepayers, and water supplies are complete. The order appears to reach self-powered sites with on-site gas generation as well, which an August directive on grid interconnection had left untouched.
On the Docket
PJM’s Interim Resource Adequacy Service (IRAS) and Large Load Registry. PJM is proposing that new loads of 50 MW or more that come online after June 1, 2027 would be curtailed before existing demand response unless they bring their own new capacity. That capacity must be new and offered into the capacity auction as a price taker for ten years. PJM asked FERC to act by Oct 12. (Docket ER26-3515-000)
MISO’s Interconnection Reliability Requirements for Large Loads. MISO filed in late August to require new large loads to meet voltage ride-through and ramping standards, so that data centers and other large loads don’t trip offline or swing abruptly during grid disturbances. Loads that begin service by December 4, 2026 would be largely exempt. In comments filed September 18 through 24, Google backed MISO’s proposed “grandfathering” approach. The Data Center Coalition and Entergy argued that late-stage projects could miss the cutoff, while state regulators and consumer advocates questioned the usefulness of basing exemptions on development status. (Docket No. ER26-3650-000)
Activity Map
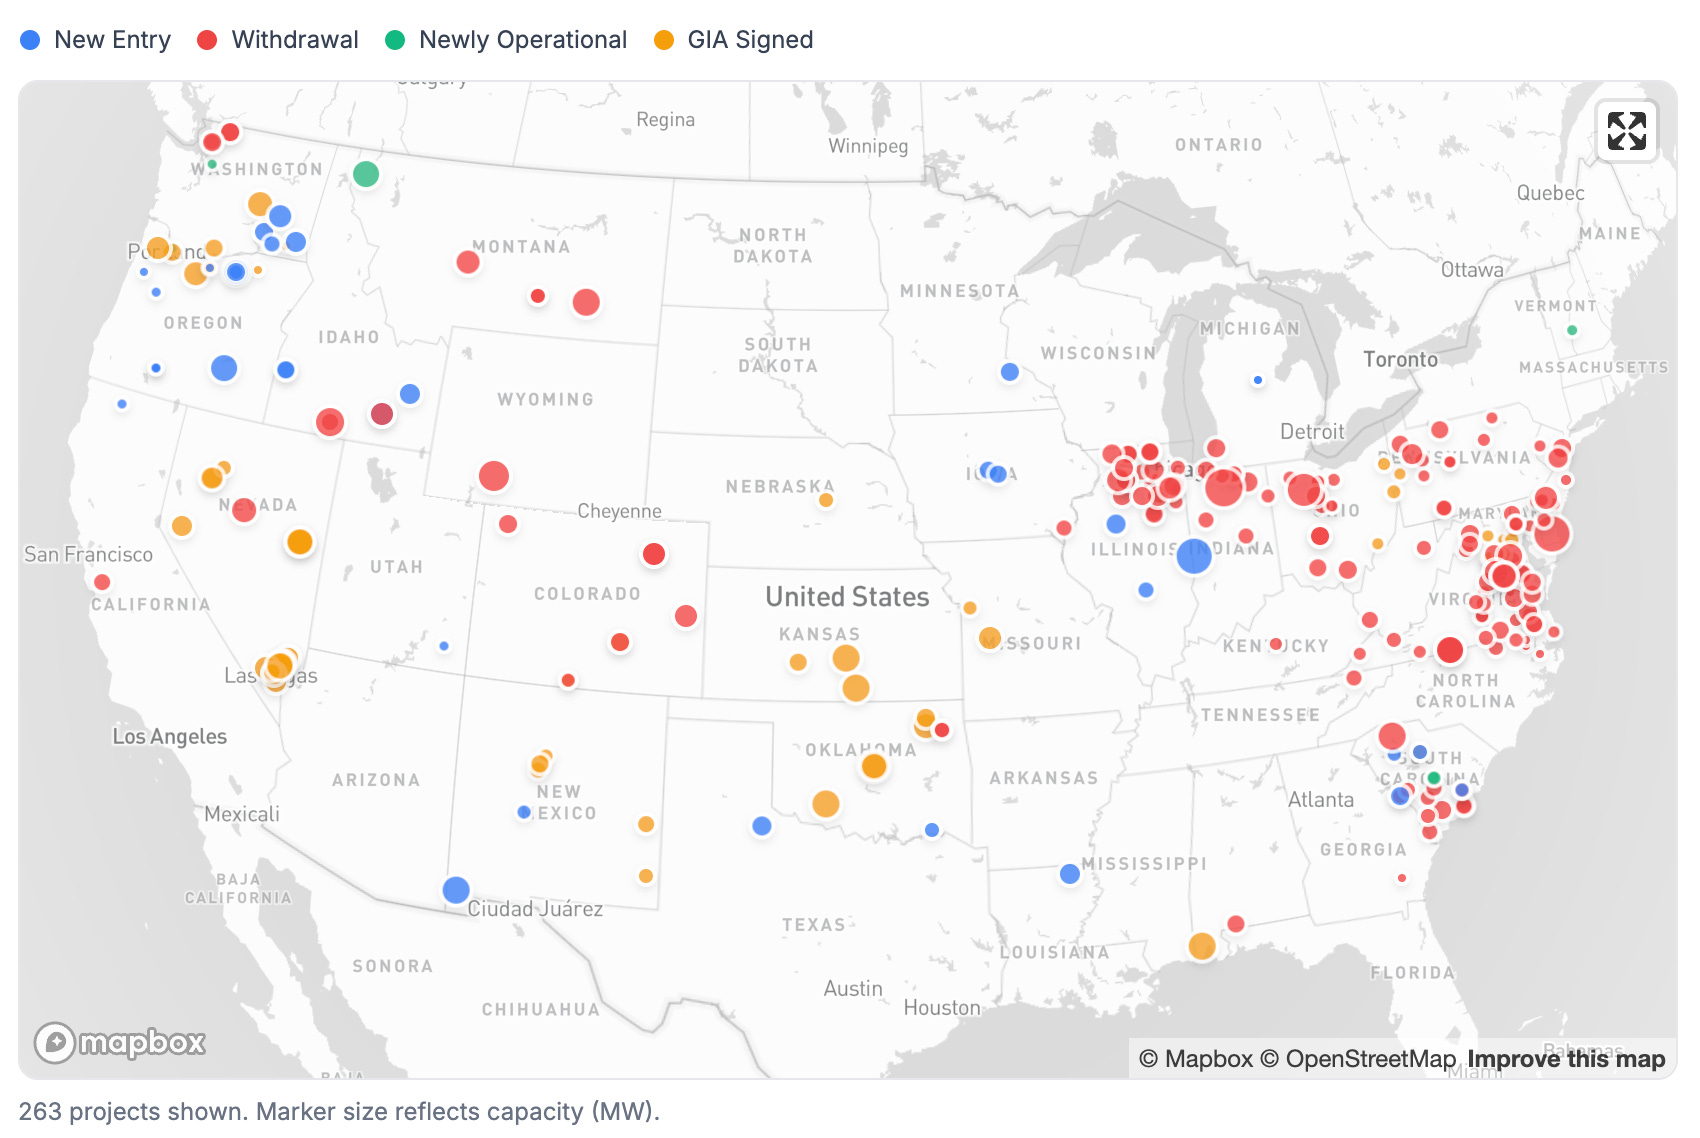
The big story this period is PJM’s Cycle 1 and TC2 withdrawals. Three areas in PJM account for most of the 21.4 GW of withdrawn project capacity:
Northern Illinois: About 5 GW across 28 requests withdrew in the ComEd zone. These withdrawals split evenly between Cycle 1 battery and solar+battery requests and older Transition Cycle 2 solar projects.
Virginia/Chesapeake region. Virginia had the most withdrawn capacity of any state within PJM, about 6.2 GW across 36 requests. Withdrawals also extend into Maryland and Delaware, where the largest exit is a 1.5 GW Cycle 1 gas request in Sussex County.
Ohio and Indiana: This area of PJM’s footprint had fewer exits, but they were much larger, including the two largest withdrawals in PJM this period: Cycle 1 gas requests of 1.75 GW in Marshall County, Indiana, and 1.2 GW in Hancock County, Ohio.
In Southern Virginia, two 650 MW gas requests in Pittsylvania County and a 520 MW request in neighboring Henry County, all from the same developer, withdrew this period. Outside of PJM, we saw a second set of withdrawals in South Carolina, composed of mostly older transition cluster records from Dominion Energy South Carolina, along with a 711 MW Duke Energy Carolinas gas request in Spartanburg County that entered the queue in March 2026.
At first glance, the Pacific Northwest and southern Idaho look like the hub of additions to the queue this period. Most of those projects, however, are affected system study records filed with Idaho Power for projects already in the PacifiCorp and Avista queues, not new requests. Elsewhere in the non-CAISO west, Tri-State added a 715 MW solar+battery request in Hidalgo County, NM and a 50 MW geothermal request in Socorro County. Withdrawals across the region are scattered: Puget Sound Energy requests in Whatcom and Skagit counties, about 1.3 GW in central and south-central Montana, a 1 GW solar+battery project in southwest Wyoming and an 800 MW wind+battery project in south-central Idaho (both had signed interconnection agreements), and roughly 1 GW in eastern Colorado.
Signed interconnection agreements cluster in Oklahoma and Kansas this period, where six SPP gas projects from its expedited resource adequacy process signed this IAs this period. MISO’s roughly 12 GW of new requests are mostly missing from the map as we work to attach coordinates to DPP-2026 records. The main exception is a 1.4 GW Duke Energy Indiana request in Vermillion County, along the Illinois border.
Queue Activity
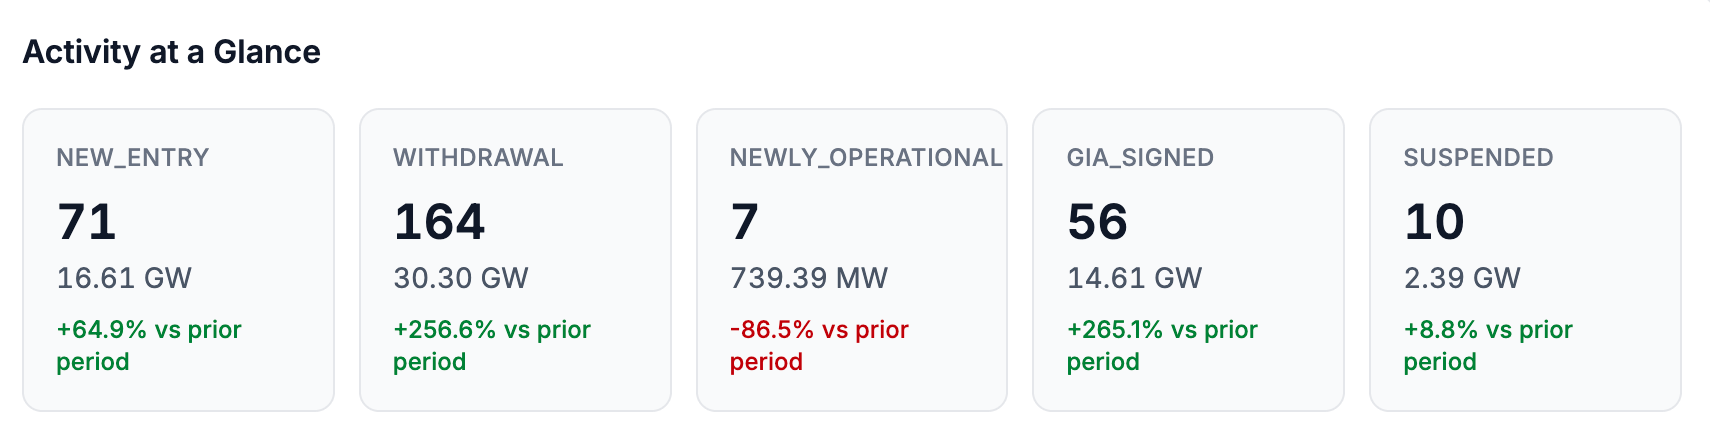
This period saw the most withdrawals since mid-August. About 30 GW left the queues and about 17 GW entered, for a net decline of nearly 14 GW. The two prior periods each saw only between 5 and 6 GW of withdrawals. As is typical for our bi-weekly updates, a few data releases drive the totals: PJM accounts for about 21 GW of withdrawals, and MISO for about 12 GW of new requests.
The headline added capacity figure of 16.61 GW overstates new entries this period. As noted above, about 3.4 GW of total new entries comes from 12 Idaho Power records that are affected system studies for projects already in the PacifiCorp and Avista queues. Excluding those, about 13 GW entered, mostly from MISO’s DPP-2026 application window which added 34 requests totaling about 11 GW. Outside MISO, genuinely new capacity was limited, led by a 715 MW Tri-State solar+battery request in New Mexico and a 252 MW battery in Texas seeking energy-only service (ERIS) through SPP’s surplus interconnection process. Like last period, the MISO DPP-2026 requests do not yet include a fuel type, so the technology mix is not quite as informative this period.
PJM’s withdrawals come from two separate cycles/processes. Fifty-one Cycle 1 requests totaling about 15 GW withdrew between September 22 and 25, just ahead of PJM’s penalty-free withdrawal deadline before Phase 1 began on September 28. Another 75 TC2 projects totaling about 6 GW withdrew on September 30, after PJM’s second decision point. We have network upgrade cost estimates for these projects as part of GridTracker, which we examine in the regional breakdown section below.
Gas accounted for the largest share of withdrawals this period at about 8.6 GW, with roughly 7 GW coming from PJM, including 7 Cycle 1 requests of greater than 500 MW in capacity. Outside PJM, about 9 GW withdrew. That total includes roughly 3 GW of projects with executed interconnection agreements, led by a 1 GW solar+battery project in Wyoming and an 800 MW wind+battery project in Idaho Power service territory.
Executed GIAs total about 15 GW, but roughly half of this total reflects status updates rather than new agreements. All 16 NV Energy agreements, about 6 GW, moved from suspended back to IA executed status, and several older BPA records reappeared. About 7 GW across 32 projects reflects agreements signed this period. SPP accounts for about 5 GW of that, including six gas projects from its Expedited Resource Adequacy Study (ERAS) process.
Queue Snapshot — Current State
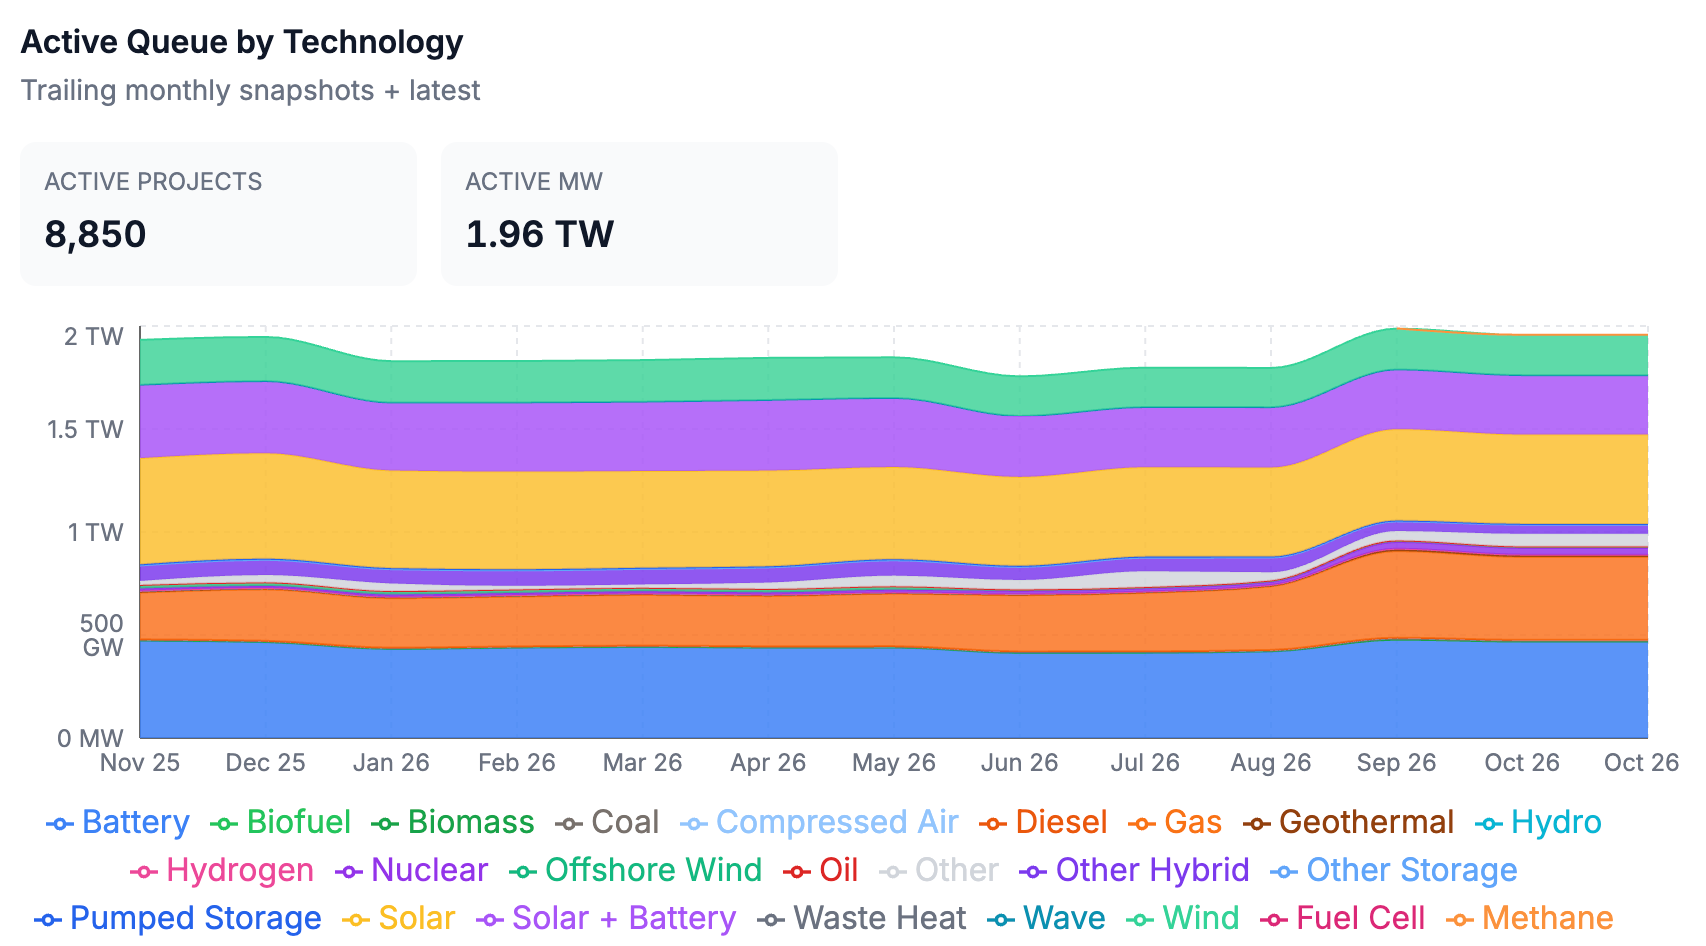
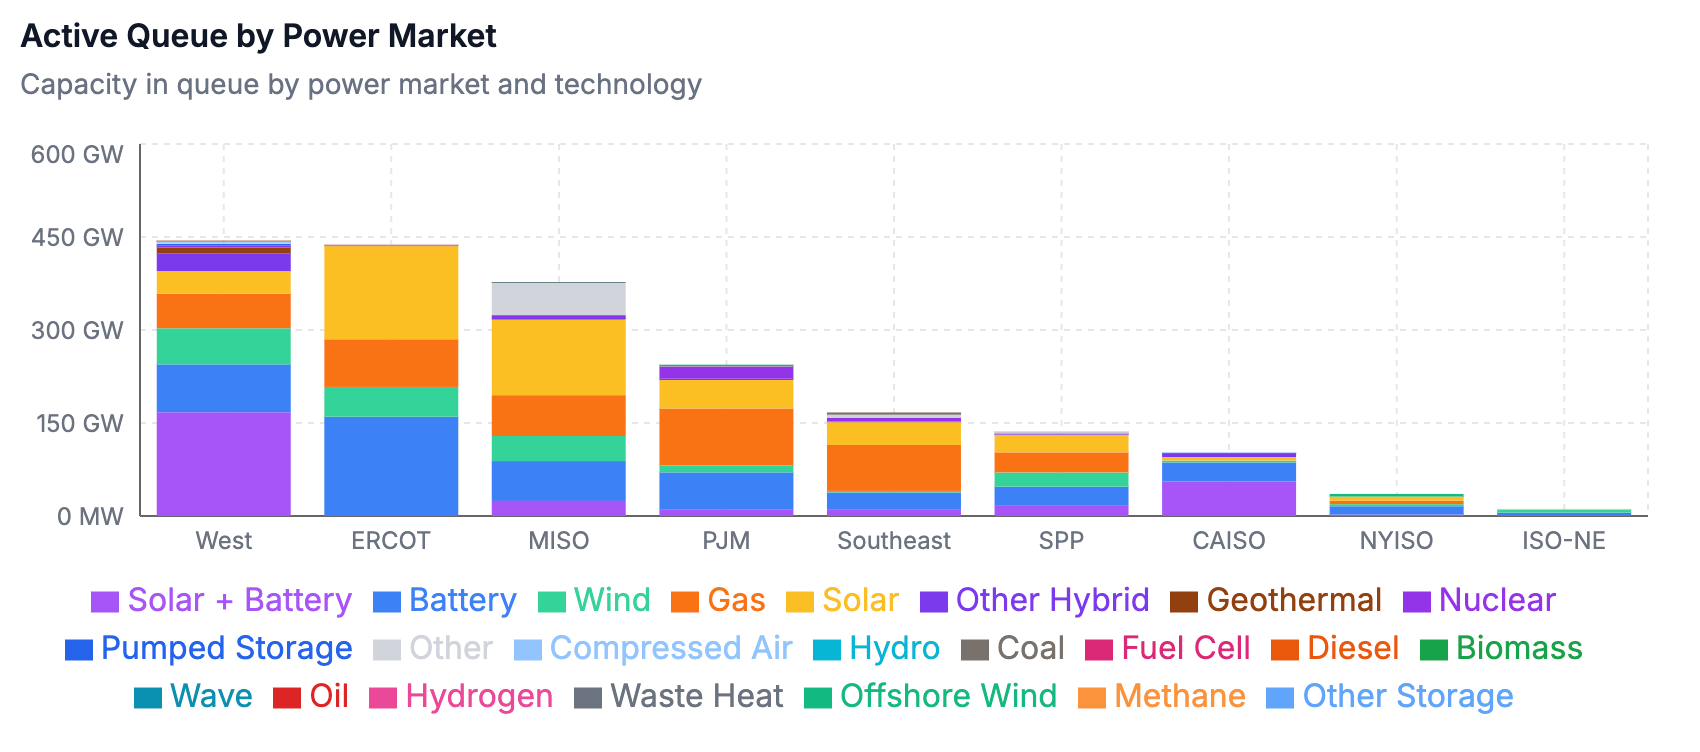
Active capacity stands at 1.96 TW across 8,850 projects, down about 20 GW and roughly 140 projects from our last edition. The national queue is back below the 2 TW mark it crossed after PJM’s Cycle 1 release. Five technologies still make up about 91% of active capacity: battery at about 468 GW, solar at 434 GW, gas at 402 GW, solar+battery hybrids at 288 GW and wind at 195 GW.
Gas recorded the largest decline of any technology, about 17 GW over the past two weeks, mostly from PJM’s Cycle 1 withdrawals. This is the first meaningful drop in queued gas capacity we have tracked in recent months, and it widened the gap between solar and gas back to about 32 GW from roughly 23 GW. Gas remains up about 78% year over year, down from about 117% in our last edition.
Regional Breakdown by ISO/RTO
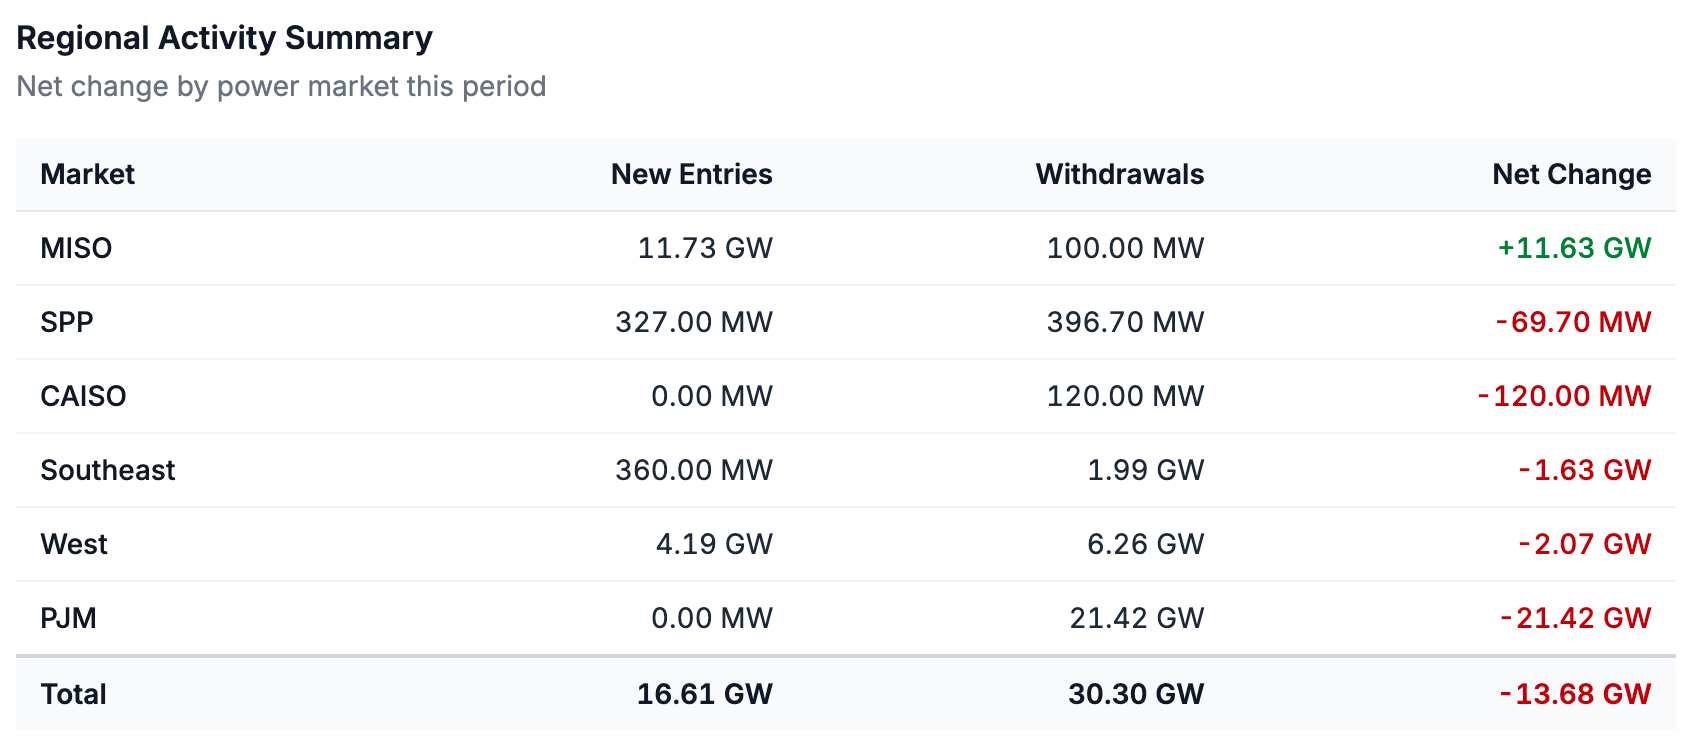
PJM had the largest net change this period, losing about 21 GW with no new requests. As noted above, these withdrawals come from (1) Cycle 1, PJM’s first cluster under its reformed interconnection process, and (2) TC2, the last of the transitional cycles PJM created to clear its legacy queue backlog.
About 15 GW across 51 Cycle 1 requests withdrew between September 22 and 25, in the days before Phase 1 studies began on September 28. Gas makes up the largest share of Cycle 1 withdrawals at about 7 GW across seven requests, followed by about 7 GW of battery and battery hybrid requests. PJM reports that 96 of the 715 projects accepted into the cycle withdrew before Phase 1, leaving 617 projects and about 169 GW in study. Since the Phase 1 study process is just getting underway for Cycle 1, we do not yet have cost estimates for these projects.
The TC2 cohort are mostly projects that originally entered the queue in 2020 and 2021. Seventy-five TC2 projects totaling about 6 GW withdrew by September 30, about three months after PJM posted their Phase II study results and asked developers to post a readiness deposit tied to their share of network upgrade costs. Unlike Cycle 1, these projects have cost estimates, which suggest that cost was a significant factor in withdrawal decisions.
Of the roughly 270 TC2 projects with Phase II results, those that withdrew make up about 28% of projects and 20% of capacity, but about 44% of allocated network upgrade costs, roughly $2.3 billion. Their median allocation was about $356/kW, compared with about $102/kW for projects still in study and essentially zero for the 12 projects that have already signed agreements. Of the 65 projects allocated more than $300/kW, 37 withdrew. Solar accounts for about two-thirds of the withdrawn capacity, and solar+battery projects carried the highest costs at about $750/kW.
Looking at zones within PJM, we see the same pattern. ComEd TC2 projects that withdrew averaged about $455/kW, about three times the roughly $160/kW for ComEd projects still under study. Some of the highest allocations belonged to small projects in western Pennsylvania and southern Virginia, where a 34 MW solar+battery project faced roughly $1,900/kW in upgrade costs. The projects that remain may see their allocations change in Phase III, as PJM restudies the cluster without the recently withdrawn projects.
TC2 has now lost about two-thirds of its capacity across three waves of withdrawals, two of which came shortly after PJM released cost estimates.
The non-CAISO West posted a net decline of about 2 GW. Its withdrawals include two projects that had signed interconnection agreements: a 1 GW solar+battery project in Wyoming and an 800 MW wind+battery project in Idaho. Puget Sound Energy withdrew six requests totaling about 1.8 GW, including a 700 MW hybrid project in Montana and two 188 MW gas requests in northwest Washington. The Southeast declined by about 1.6 GW, led by a 711 MW Duke Energy Carolinas gas request that withdrew about six months after entering the queue. SPP and CAISO saw only small changes this period, and ERCOT, NYISO and ISO-NE recorded no activity.
Notable Projects
It’s worth digging into the interconnection agreements signed this period. Most of the GIAs signed this period are for projects that were studied via expedited or limited-purpose paths rather than standard cluster studies.
The largest group comes from SPP’s ERAS process. Six ERAS gas projects totaling about 4 GW signed agreements this period: two Oklahoma Gas and Electric units at its Horseshoe Lake substation in Oklahoma City, two Evergy units in south-central Kansas, and two AEP units in Oklahoma. All six entered the queue in September and October 2025, roughly a year before signing an IA. Their allocated network upgrade costs average about $25/kW. Across the full SPP ERAS cohort, 11 projects have now signed agreements and the remaining 25 moved to pending agreement status on October 2. The process still ran later than planned, since SPP had expected to issue ERAS agreements by the end of March. The six projects that signed this period list proposed in-service dates between 2029 and 2030.
SPP also executed agreements for five surplus interconnection batteries totaling about 750 MW. The largest is a 400 MW battery in Henry County, Missouri. Most of these requests reached signed agreements within about 13 to 18 months of entering the queue. By comparison, a 215 MW wind project from SPP’s 2022 cluster, which also signed this period, took more than three and a half years and was allocated about $150/kW in upgrades.
In PJM, eight of the 12 TC2 projects that signed agreements this period are small gas additions at existing plants selected through the Reliability Resource Initiative, PJM’s one-time process for fast-tracking projects that could address near-term reliability needs. They include units at Dominion’s Remington and Possum Point stations in Virginia and at the Lordstown and South Field plants in Ohio. Together they total about 330 MW, and most were allocated no network upgrade costs.
Want to go deeper? GridTracker users get access to:
Project-level insights (see the project-level changes that occur in real-time)
Exportable datasets (export the full list of newly operational, withdrawn, GIA-signed, and added projects)
Interactive graphs and visualizations
Custom dashboards with real-time alerts and data export
Exclusive in-depth industry reports
… and much more!
Those Virginia and ComEd exits land in the two zones where data center load is tightest. As of Oct 7, DC Hub's power index has Ashburn at AVOID (21/100, about a 40-month queue, roughly 3.2 GW of additions due within 12 months) and Chicago at AVOID (21.8, about a 36-month queue, reserve margin 12.5% against the 13% NERC floor). Losing 6.2 GW of Virginia requests and about 5 GW in ComEd in two weeks makes PJM's IRAS curtailment proposal for new 50 MW+ loads look less like a backstop and more like the default path. Source: DC Hub (dchub.cloud), as of Oct 7, 2026.