


Executive Summary
The following entities updated their queue data this period: ERCOT, MISO, PJM, SPP, ISO-NE, CAISO, PacifiCorp, Idaho Power, Bonneville Power Administration (BPA), Arizona Public Service (APS), Public Service Company of New Mexico (PNM), Puget Sound Energy, Black Hills Colorado Electric, El Paso Electric, Southern Company.
Additions: 50.5 GW (201 projects)
MISO: 18.4 GW across 60 new requests, including 58 additional DPP-2026 requests.
Non-CAISO West: 16.5 GW across 104 records. PacifiCorp Cluster 6 accounts for 14.9 GW (100 requests) across OR, UT, WY, ID, and WA.
ERCOT: 15.7 GW from 37 requests.
By resource type: Gas 13.3 GW, battery 6.8 GW, solar 5.7 GW, solar+battery 2.6 GW, geothermal 1.9 GW, wind 1.55 GW. Note that the MISO DPP-2026 requests do not currently report a fuel type.
Withdrawals: 15.5 GW (95 projects)
ERCOT: 8.0 GW (53 projects).
Non-CAISO West: 6.1 GW (24 projects). BPA 3.07 GW (9), APS 1.58 GW (6), PNM 676 MW (3 projects), Idaho Power 600 MW (4), Puget Sound Energy 100 MW, Black Hills Colorado 60 MW.
MISO: 549 MW (5 projects), all legacy (DPP-2017 through DPP-2021) queue requests in IN and WI.
PJM: 459 MW (10 projects), all of which had executed interconnection agreements and entered the queue between 2017 and 2020.
ISO-NE 170 MW (1), SPP 123 MW (1, ERAS battery), CAISO 100 MW (1)
By resource type: battery 7.5 GW, solar 5.1 GW, wind 2.1 GW, solar+battery 0.76 GW. No gas queue withdrawals this period.
Other Activity:
GIAs: 23 projects, 4.5 GW. ERCOT 8 (1.7 GW), West 6 (1.2 GW), SPP 5 (997 MW), Southern Company 3 (499 MW), PJM 1 (191 MW).
Newly operational: 13 projects, 1.6 GW. ERCOT 10 (1.2 GW, CODs between Oct 2–28), SPP 1 (252 MW solar, Grady County, OK; COD Oct 22), Southern Company 1 (58 MW, battery storage, Floyd County, GA; COD Oct 16), PJM 1 (45 MW solar, Kent County, MD; COD Aug 4).
Policy Watch
In the News & On the Docket
Google backs geothermal development in Oregon. Google agreed to buy power from Quaise Energy’s Project Obsidian, near Newberry Volcano in central Oregon. Google plans to buy 50 MW and Quaise is seeking offtakers for an additional 200 MW at the site. The active queue currently includes substantial geothermal requests in the same area. This period, PacifiCorp’s Cluster 6 added a 200 MW geothermal request in Deschutes County, with a proposed in-service date of December 2030. BPA’s queue already holds two Mazama Energy geothermal requests in the county (216 MW and 54 MW).
Voters support limits on data center development. In the midterm elections, local voters largely sided with limits on data center development. Ballotpedia tracked 41 data center ballot measures in 10 states, and the side limiting data centers won 40 of 41. There were no statewide or national data center measures on the midterm ballot. Ohio had the most data center-related ballot measures, with 21 proposals, including restrictions on facilities consuming more than 25 megawatts of electricity in several municipalities. The measures are local and don’t directly affect generation queues, but they add siting risk to the large loads behind much of the recent gas activity in the queues.
Large load interconnection reform filings are here. Proposals from grid operators in response to FERC’s June 2026 show cause orders have landed. At a high-level:
PJM proposed a “Fast Energization Process” that would study large load and generation requests in a single one-year process, about twice as fast as the current process.
MISO proposed a Large Load Project Review process, new transmission service options, and cost recovery agreements to prevent cost shifts to existing customers.
CAISO proposed new service options for flexible large loads that can cut their use when transmission capability is unavailable.
ISO-NE would require large loads to bring their own new capacity.
Texas PUC proposes a standard large-load interconnection agreement. On Nov 5, the PUCT proposed a Standardized Large Load Interconnection Agreement that would serve as the standard agreement for all large loads connecting in ERCOT. It implements SB 6, and the draft would require large loads to disclose water and energy usage. It would also reallocate a customer’s transmission capacity if its phased energization is delayed more than 24 months. Comments are due Dec 14. (PUCT Project 59999)
Activity Map
We saw new additions, withdrawals, and GIA activity across Texas over the last two weeks. Most of the new ERCOT gas requests landed in central and east Texas, along with a group in the southern portion of the state near the Rio Grande Valley. Withdrawals are spread throughout counties across the state, with the highest concentration in the Coastal Bend counties (2.3 GW, n=7) and the greater Houston area (1.6 GW, n=10). ERCOT also added smaller solar and battery requests north of Abilene (1.6 GW, n=9) and south of San Antonio (850 MW, n=5). Signed IAs are more scattered, with three in East Texas.
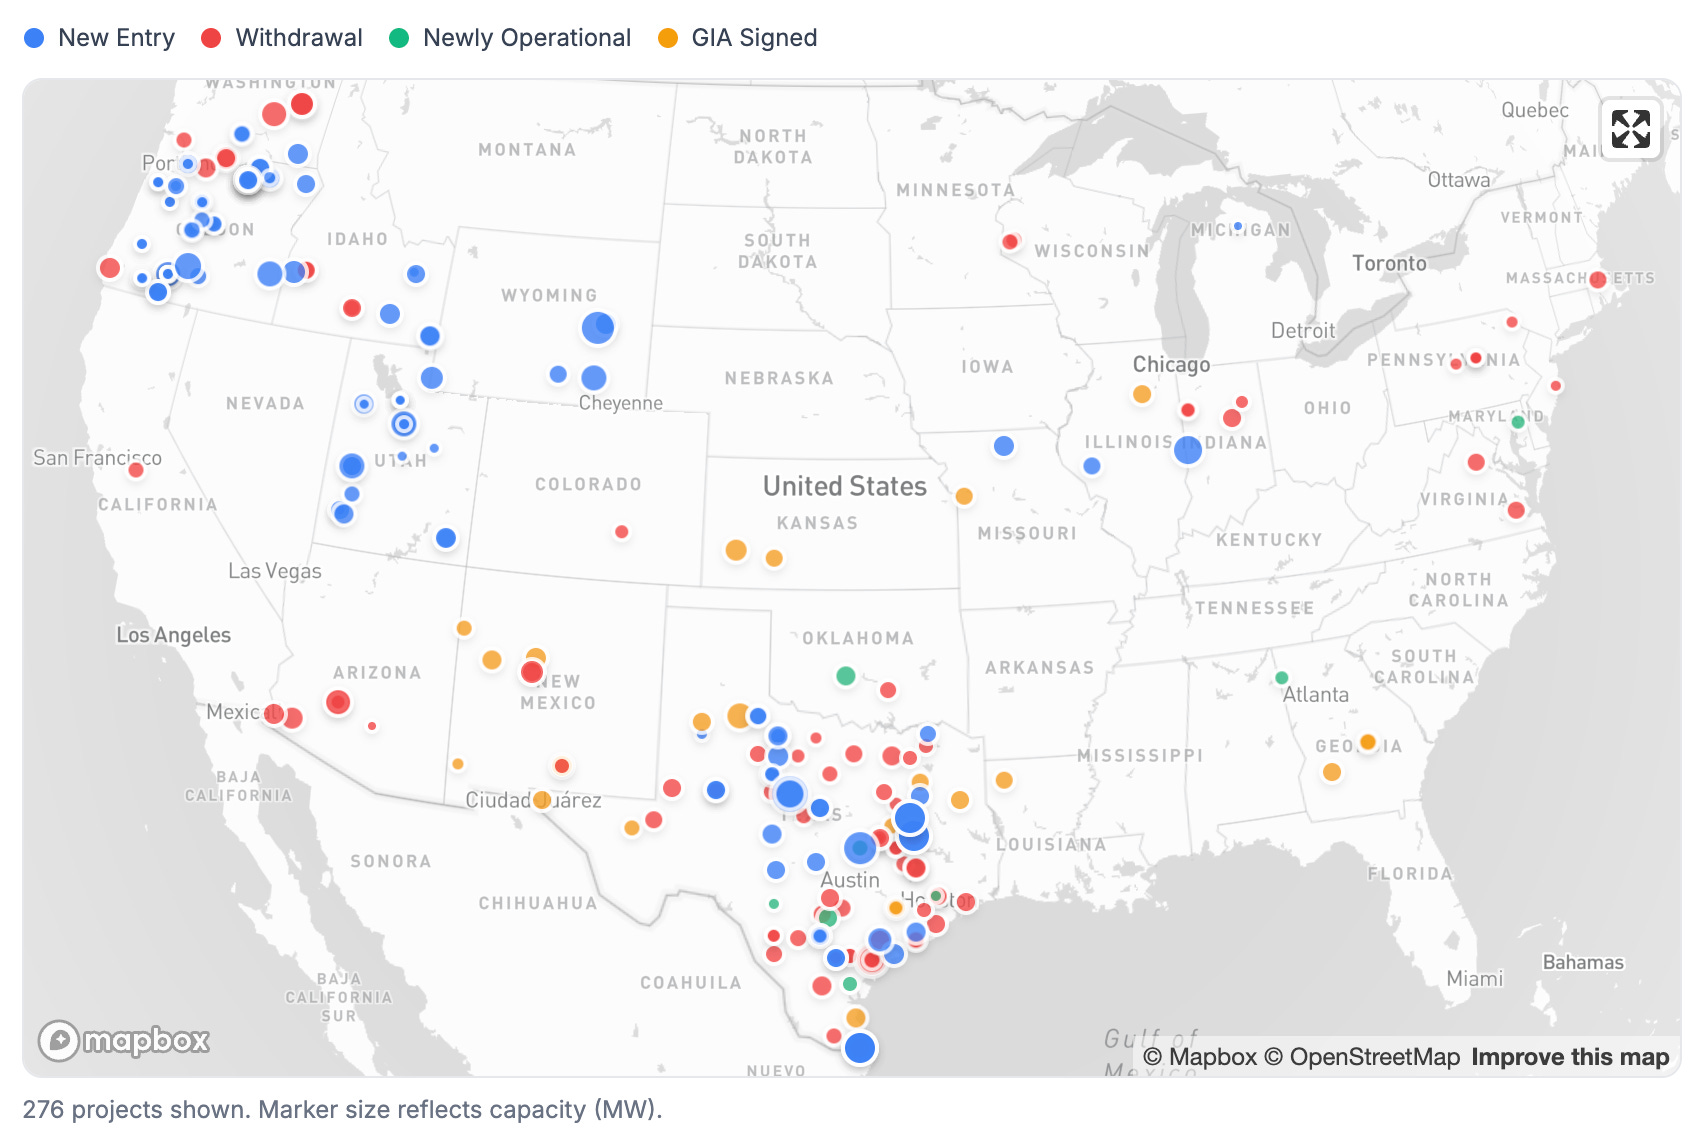
In the non-CAISO West, new requests stretch from southern Washington across Oregon and into Utah, Idaho and Wyoming. Withdrawals are concentrated in Washington, with a second group around Phoenix and central New Mexico.
Outside Texas and the West, signed agreements this period are in New Mexico, Kansas, and Georgia. We also see a handful of withdrawals across PJM’s service territory. As with the last round of MISO DPP-2026 additions, most of this period’s new MISO requests have no coordinates, so they don’t appear on the map.
Queue Activity
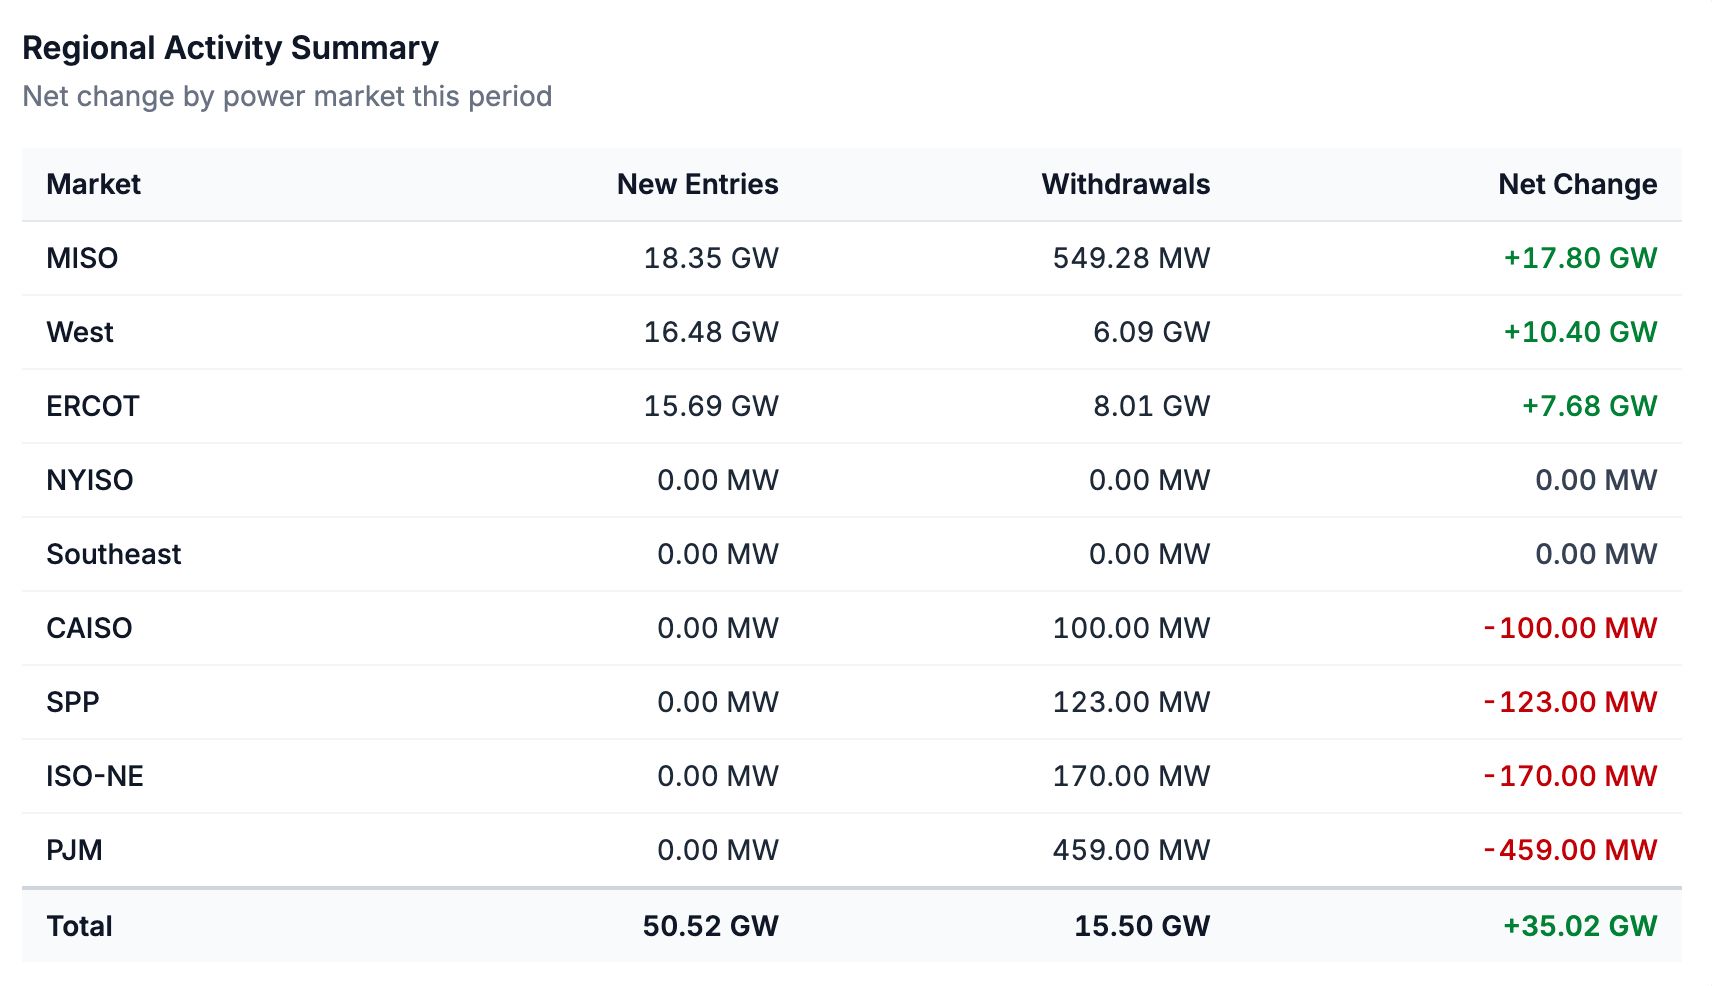
On net, the queues added about 35 GW of new capacity this period: roughly 51 GW of new requests against 16 GW of withdrawals. This is a reversal of the net decline we observed at the end of last month, when MISO’s DPP-2022 withdrawals pushed queue exits above 35 GW. Additions increased about 70% from the prior period, and represent the largest two-week total since early August. As usual, a few data updates account for most of the new activity: PacifiCorp’s Cluster 6 posting, ERCOT’s queue data update, and another set of MISO DPP-2026 requests.
MISO added 58 more DPP-2026 requests (about 18 GW), posted in batches between Oct 31 and Nov 11. As with the other batches of DPP-2026 requests we’ve analyzed, almost none of these new MISO requests list a fuel type. By MISO’s DPP study regions, Central (8.8 GW) and West (7.0 GW) account for most of the new capacity added this period, and Duke Energy Indiana alone accounts for 10 requests and about 4 GW. Overall, DPP-2026 now includes 374 active requests totaling 122.3 GW, up from 320 requests and 104.8 GW at the end of October.
Out in the West, PacifiCorp posted requests from their generator interconnection Cluster 6. This cluster includes 100 active requests totaling about 15 GW, filed during the application window from Sep 10 to Oct 21. Fifty-two requests of 100 MW or more account for nearly all of that capacity. Another 45 are smaller requests, mostly batteries and solar under 10 MW. The resource mix of Cluster 6 leans more toward firm resources than PacifiCorp’s recent clusters, with about 2.5 GW of gas, 1.9 GW of geothermal and a 600 MW nuclear request. Cluster 6 is also smaller than PacifiCorp’s previous clusters, and 19 of its requests (roughly 1.9 GW) had already withdrawn before appearing in the queue data.
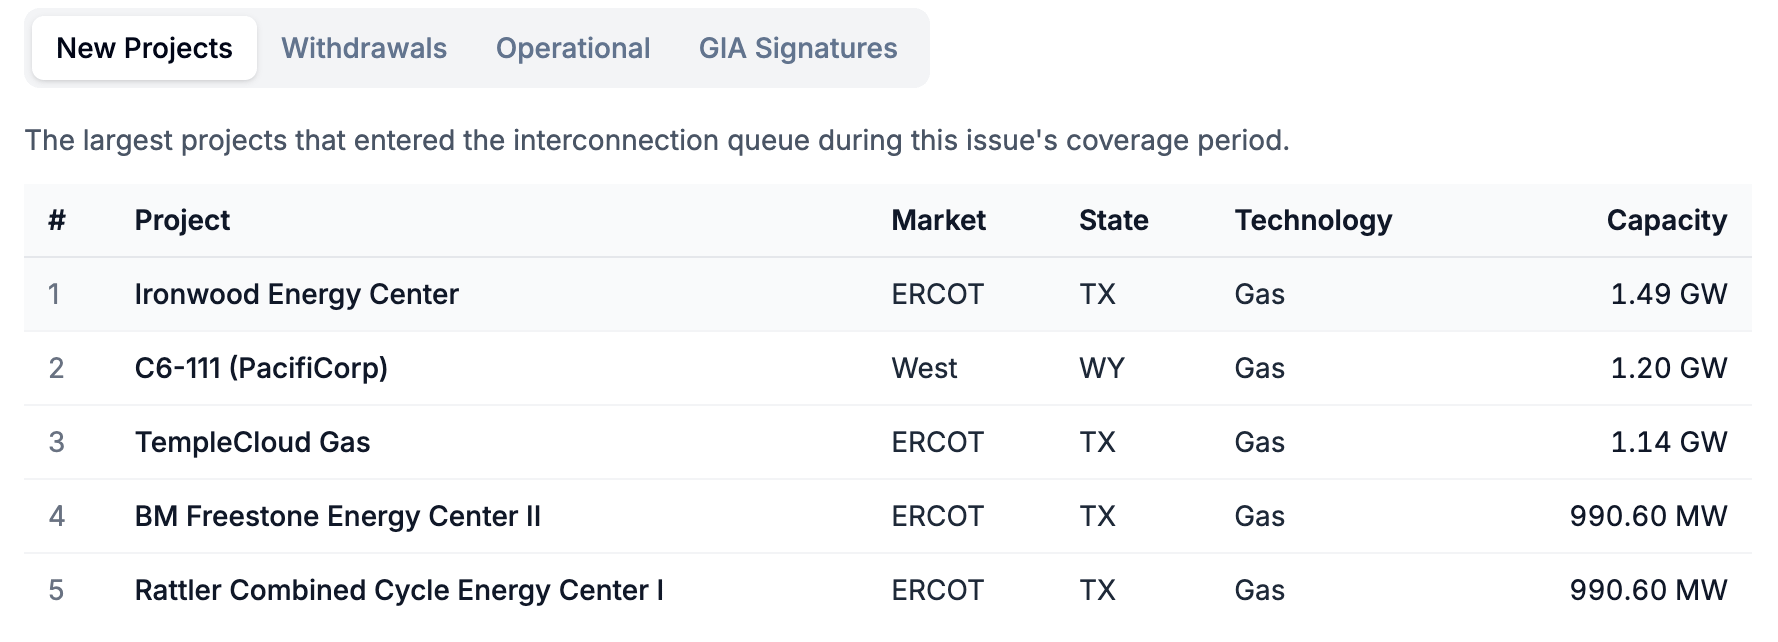
ERCOT’s latest data update added 37 projects and about 16 GW in total, 11 GW of which is gas. Seven of the gas requests are 990.6 MW combined-cycle units at three sites in Cameron, Freestone and Leon counties. There are also three other large gas requests: two Ironwood Energy Center requests near Abilene (1.5 GW and 740 MW) and a 1.1 GW request in Bell County. ERCOT’s active gas queue grew from about 79 GW to 90 GW with this latest batch of requests. The rest of ERCOT’s new requests are solar (11 requests, 2.6 GW) and battery storage (15 requests, 2.4 GW). Across all markets, gas accounts for roughly 41% of the additions for which we have a fuel type this period.
ERCOT also accounts for about half of this period’s withdrawals (53 projects, 8.0 GW). Battery and solar projects accounted for 51 of the 53 withdrawals (7.8 GW, or 97% of withdrawn capacity), split between 31 batteries (4.4 GW) and 20 solar projects (3.4 GW). Most were still in facility study, but 11 (3.0 GW) had executed interconnection agreements. The largest IA-stage withdrawals were Ross Solar and Ross Storage in Refugio County (1.5 GW combined). Both had executed IAs and proposed in-service dates in mid-2027.
In the West, withdrawals totaled about 6 GW (24 requests). BPA accounts for about half (3.1 GW), including three wind requests in Lincoln County, WA (about 1.4 GW). APS withdrew five requests filed in May 2025 (about 1.6 GW) in the Phoenix and Yuma areas. Two battery requests in PNM withdrew within three months of entering the queue.
Withdrawals in other markets were small and appear to be mostly legacy queue requests. PJM’s 10 withdrawals (459 MW) were all older solar projects with executed interconnection agreements, queued between 2017 and 2020. MISO’s five withdrawals (549 MW) all came from DPP-2021 and earlier cycles, and no DPP-2026 requests withdrew.

Queue Snapshot — Current State
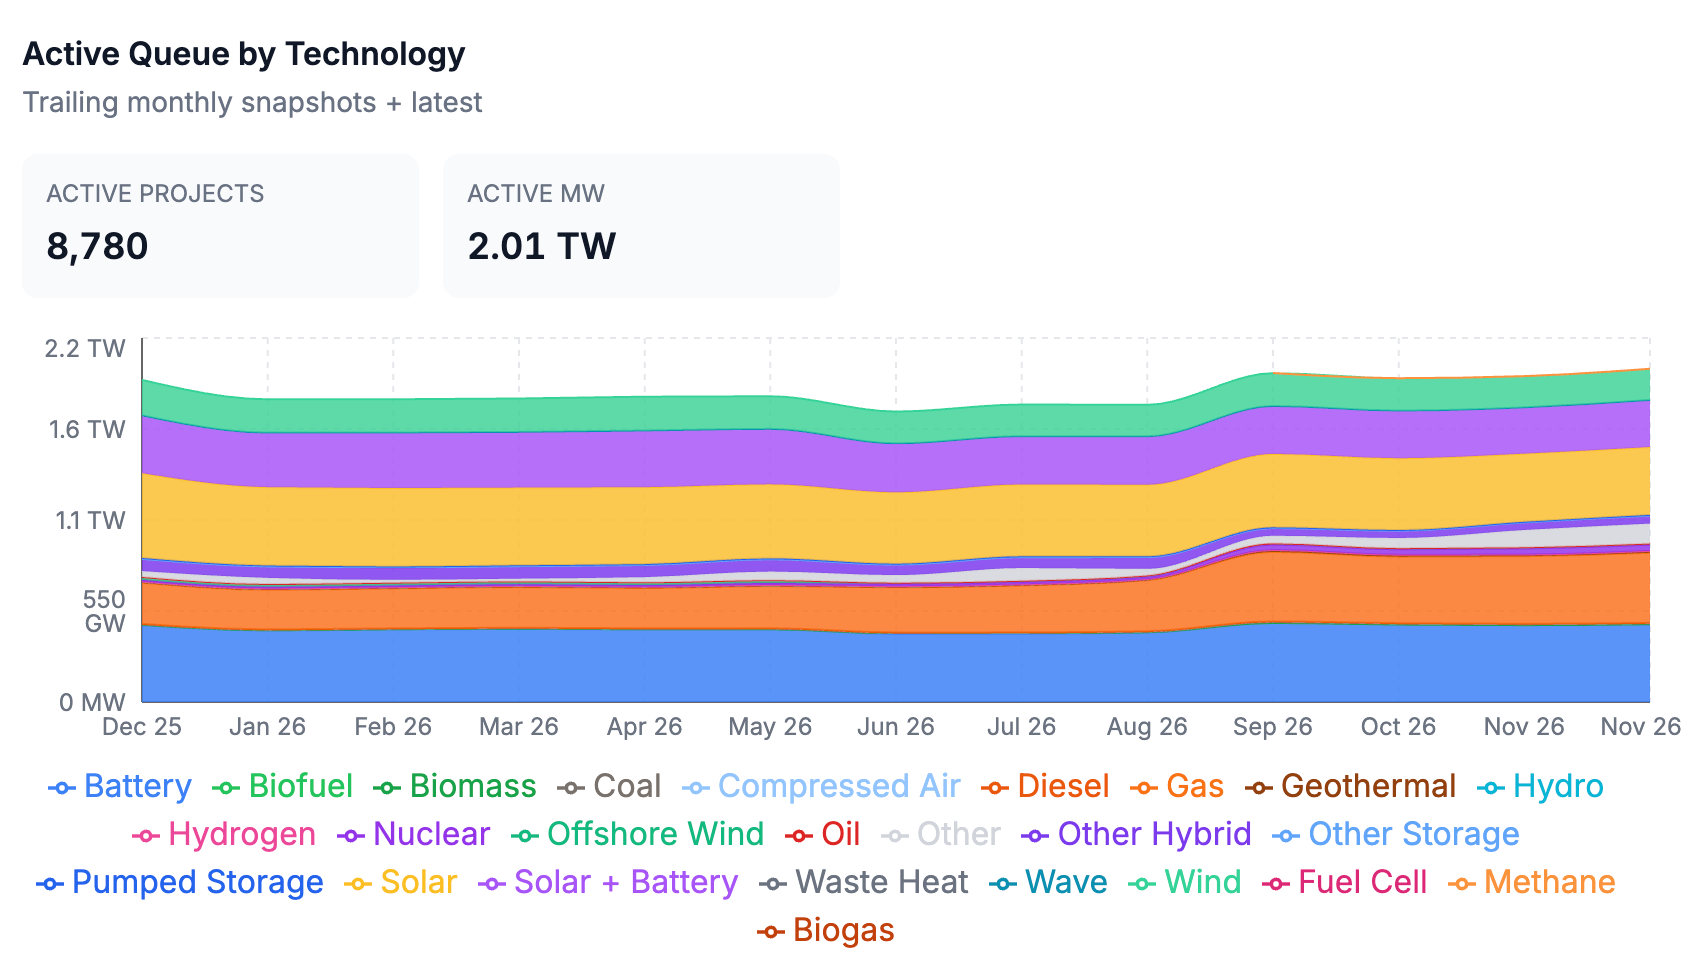
The active queue sits at 2.01 TW across 8,780 projects, up from 1.98 TW in the previous period. Battery storage still leads all fuel types at about 469 GW, but gas (423 GW) now ranks second, ahead of solar (410 GW). Gas is up about 70% year over year; standalone solar and solar+storage are each down about 20%. Among firm resources, nuclear sits at about 37 GW and geothermal about 10 GW, roughly double its level a year ago, with most of this period’s increase coming from PacifiCorp’s Cluster 6.
Regional Breakdown by ISO/RTO
MISO (+17.8 GW), the non-CAISO West (+10.4 GW) and ERCOT (+7.7 GW) account for all of this period’s net growth. PJM, ISO-NE, SPP and CAISO saw only a few legacy withdrawals. The non-CAISO West’s active queue grew to about 466 GW (accounts for 32 BPA requests returning to active status in the data), putting it back ahead of ERCOT (about 446 GW) as the largest regional queue. MISO is at roughly 400 GW thanks to another batch of DPP-2026 requests. We did not see further DPP-2022 withdrawals this period. The next DPP-2022 study milestone is Dec 18.
Notable Projects
Seven of ERCOT’s new gas requests appear to be identical 990.6 MW combined-cycle gas units filed by the same interconnecting entity, Black Mountain Energy Storage II. They are located across three sites: Rattler in Cameron County, BM Freestone in Freestone County, and Great Rock in Leon County, all with a proposed in-service date of May 2029. Black Mountain already had gas requests at the Freestone and Leon County sites and at five others across the state. With the new requests this period, Black Mountain’s total active queued capacity is roughly 13 GW of gas requests across 14 records. Black Mountain describes its current strategy as developing “powered land” for hyperscale data centers. Its recent queue filings fit a broader pattern we are seeing in ERCOT and other markets, where developers appear to be prioritizing gas to serve data center load.
Unlike PacifiCorp’s previous generation interconnection clusters, where solar+storage hybrids accounted for about 40-60% of requested capacity, Cluster 6 leans more towards firm resources. About a third of Cluster 6’s capacity (5 GW of 15 GW) is gas, geothermal, or nuclear. The seven geothermal requests (1.9 GW), concentrated in southwest Utah and Oregon, are substantially higher than the less than 100 MW of geothermal in each of PacifiCorp’s two previous clusters. We will continue to track the mix of firm and variable resources in new clusters across markets to see whether developers are continuing the shift toward gas and other firm resources and away from solar, wind, and hybrid projects.
Want to go deeper? GridTracker users get access to:
Project-level insights (see the project-level changes that occur in real-time)
Exportable datasets (export the full list of newly operational, withdrawn, GIA-signed, and added projects)
Interactive graphs and visualizations
Custom dashboards with real-time alerts and data export
Exclusive in-depth industry reports
… and much more!
Is the load side tracked as its own record type in here, or does it only show up through the service requests it triggers? The 50.5 GW added this period is all supply, and the large-load filings are the other half of the same queue problem.
PacifiCorp's 14.9 GW Cluster 6 stands out against where large load is trying to land in that footprint: DCPI (Data Center Power Index) has Salt Lake City at 45.8, CAUTION (DC Hub (dchub.cloud), as of Nov 18, 2026). How much of that cluster survives restudy could matter a lot for the Utah side. Curious whether you're seeing large-load requests show up in the same window. Live market scores: https://dchub.cloud/connect?via=substack