
GridTracker Insights — May 2 – 15, 2026
The most important U.S. grid updates from the past 2 weeks


Note: This report covers all U.S. transmission grid interconnection queues
A Quick Introduction
Welcome to the first issue of our newsletter, authored in partnership with Nick Manderlink. Nick spent two years at Lawrence Berkeley National Lab’s Energy Markets and Policy Group, where he contributed to Queued Up, the annual report widely treated as the standard reference on U.S. interconnection queues. We worked closely with Nick during his time at LBNL, and there’s nobody we’d rather have helping us unpack the queue data every two weeks. This newsletter delivers biweekly insights into the most relevant updates that affect the U.S. grid and the projects planning to interconnect to it. We’ll surface relevant news, regulatory insights, and of course, in-depth intel on what is changing in the interconnection queues across the country.
Executive Summary
The past 2 weeks have seen exceptional activity in the queues. 157 new projects totaling 36.92 GW entered the queues against 4.56 GW of withdrawals, largely driven by 25 GW of additions from Southern Company’s 2026 cluster window. The broader renewable versus firm/thermal bifurcation of the queues continues: gas led additions this period (roughly 20 GW added, +50% YoY), while renewable and battery storage queue capacity continues to contract. Regional trends and totals will be impacted by the 811 recently announced new projects (220 GW) from the first cycle of PJM’s reformed interconnection process.
In the News
PJM capacity market overhaul. PJM released a whitepaper last week, Powering Reliability Through Market Design, proposing three frameworks for reforming its capacity market amid skyrocketing demand.
The options outlined are:
Stabilize the existing capacity market
Differentiate grid reliability by customer type or geography
Transition to an energy and ancillary services market with contracting requirements to guard consumers against energy price volatility.
FERC approved PJM’s extension of the existing capacity auction price cap and floor for two more years on April 28th.
FERC action on large load interconnection is looming. Last month, FERC announced that they will act by June on DOE’s October 2025 ANOPR (Docket RM26-4-000). The ANOPR directs FERC to issue a set of reforms standardizing the interconnection process for data centers and other large loads.
NextEra & Dominion mega-merger announced. NextEra Energy announced on May 18th it has agreed to acquire Dominion Energy in a $67 billion deal, creating the largest regulated utility business in the U.S. Particularly timely given Virginia’s April 2026 legislation requiring Dominion to procure 16 GW of short-duration storage and 4 GW of long-duration storage by 2045.
Hot rocks and hot stocks. Geothermal continues to have its moment. Fervo Energy raised $1.89 billion in its IPO this past week. Amazon recently announced a PPA for 100 MW of geothermal from Zanskar in Nevada.
Worth a Read
Substack commentary on PJM’s recent capacity market whitepaper from Lynee Kiesling and Elizabeth K. Whitney.
For those of you tuned in to the ongoing discussions surrounding the rate impacts of large loads, Brattle Group and ESIG released a great primer on the topic.
Where’s the Activity?
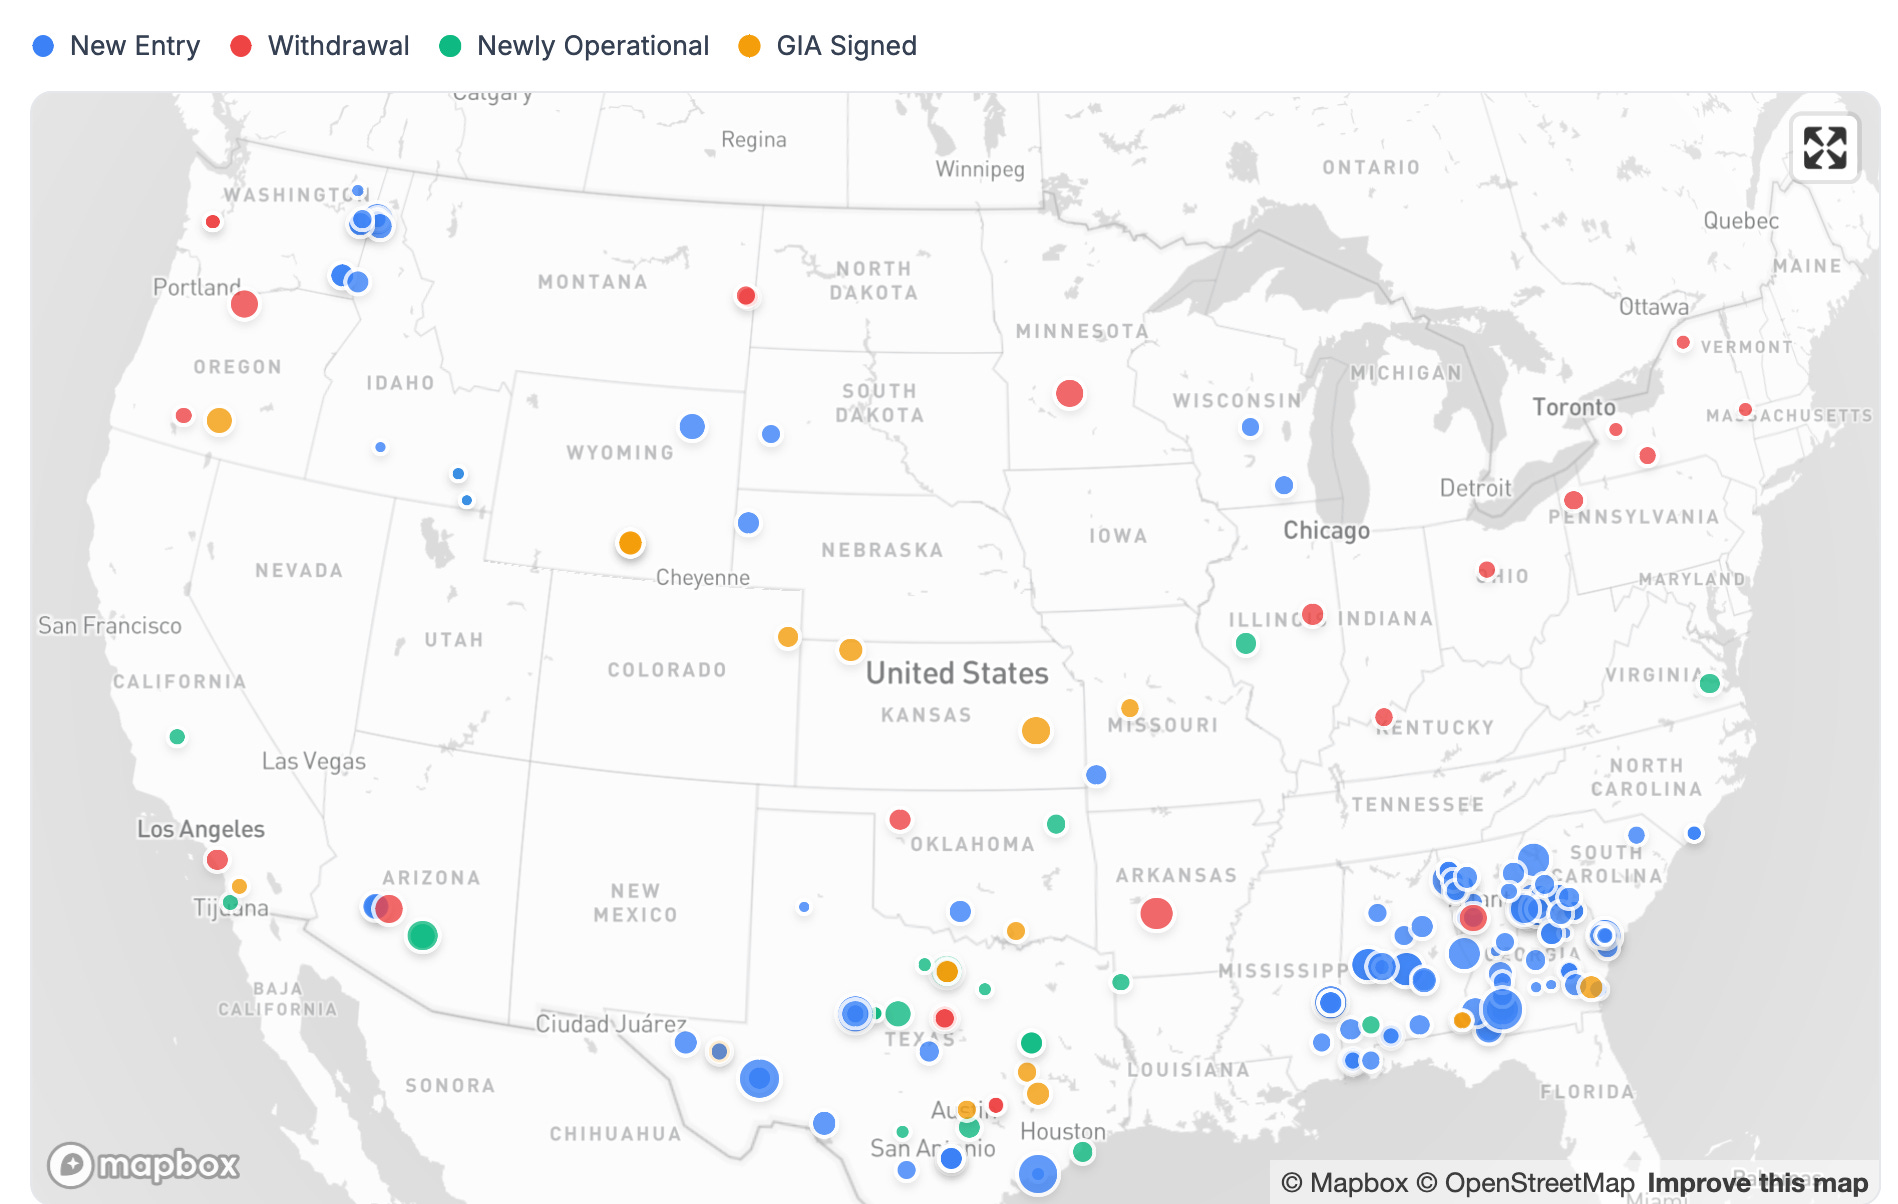
New queue entries during this period are clustered most heavily in the Southeast, ERCOT, and the Pacific Northwest (Avista). We also see a smattering of queue additions across the non-CAISO West (PacifiCorp/Idaho Power) and the Midwest/Plains.
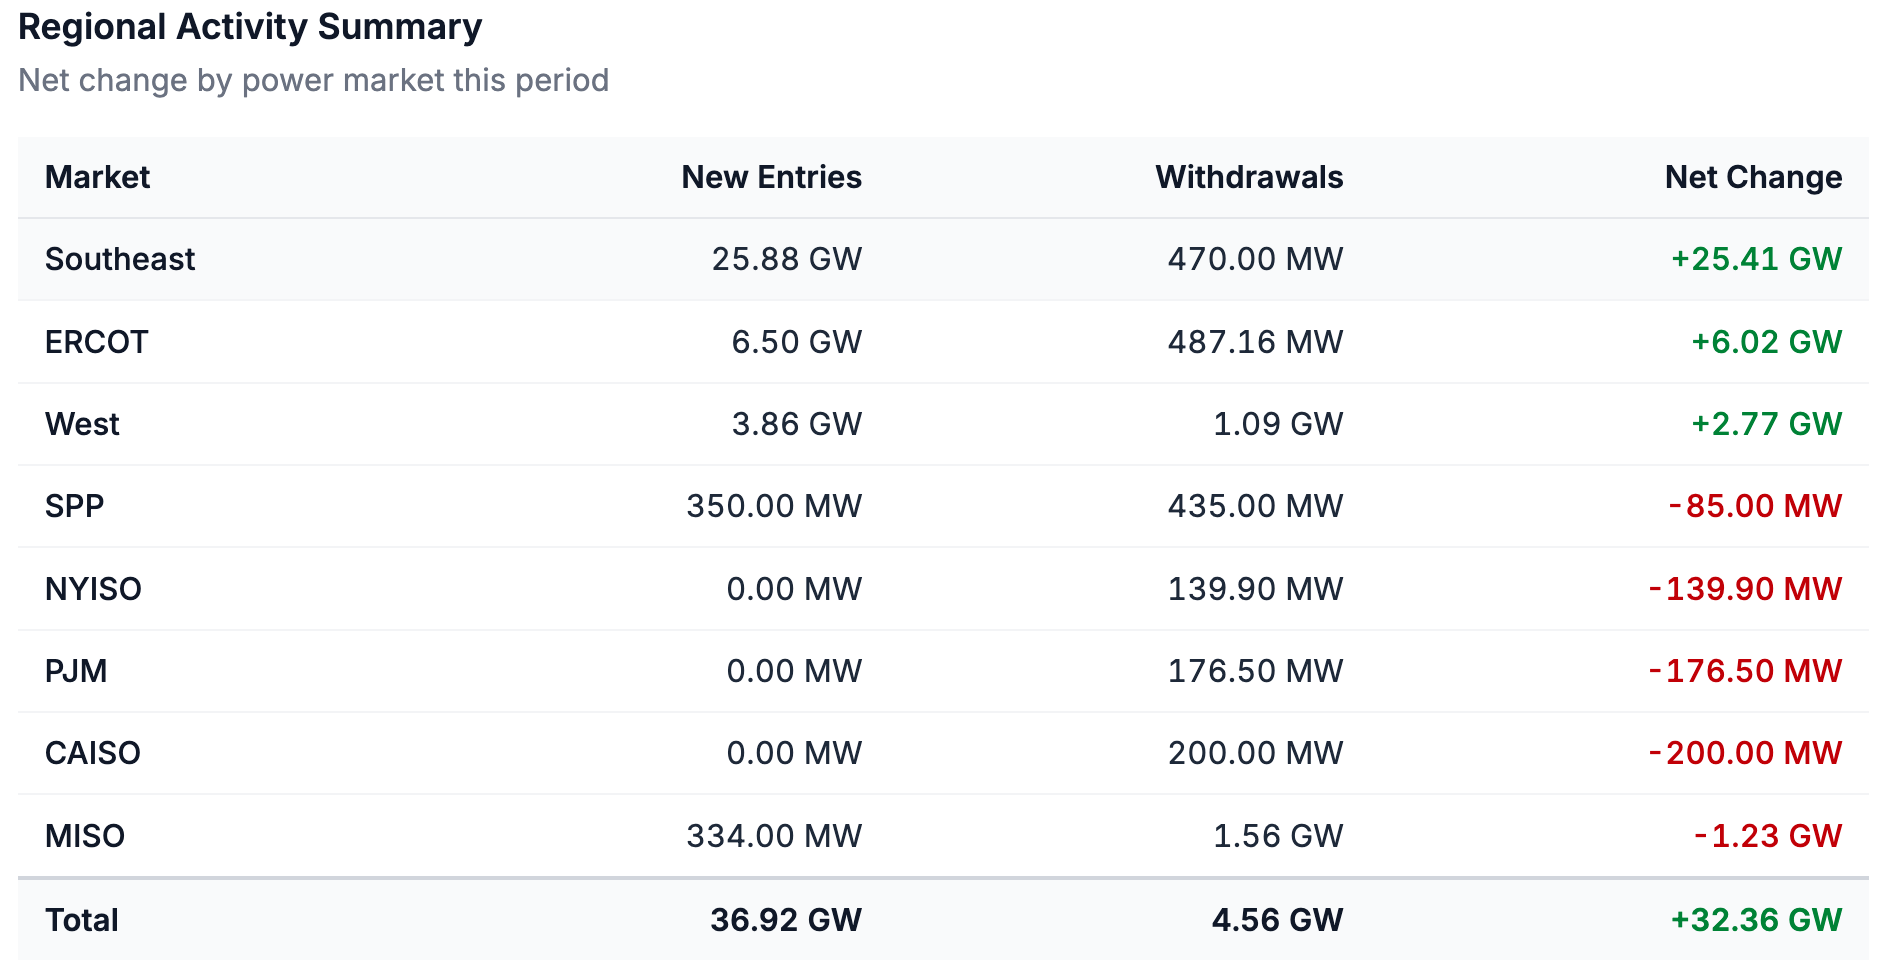
The Southeast led all regions in new capacity additions at just under 26 GW, driven almost entirely by new gas projects in Southern Company’s service territory following the April 3rd close of Southern Company’s 2026 cluster request window. ERCOT added another 6.5 GW of capacity over the past two weeks, with three of the five largest new requests sited in Texas.
Withdrawals were modest and broadly scattered during this period. No single region or utility drove meaningful attrition, and at 4.56 GW, this period’s withdrawal volume was roughly 60% lower than the prior two-week period.
More than 700 GW of capacity exited U.S. queues in 2025 as FERC Order 2023 and other ISO- and utility-specific reforms cleared out a backlog of projects unlikely to ever be built. The relative lull in withdrawals over the last two weeks may not be indicative of a slowing of withdrawal rates in 2026. Two major ISO clusters could drive significant withdrawals this year. SPP has yet to publish updates to its DISIS 2024 cluster data since its Phase 1 results in March, and PJM’s first reformed cluster window (811 projects, 220 GW) only closed on April 27th, with no early-stage withdrawals yet reflected in the PJM data.
Newly operational projects appeared across the country, with battery projects coming online in CAISO and ERCOT, solar in SPP and the Southeast, as well as gas and oil in ERCOT and the Southwest. We also see roughly 4 GW (19 projects) with newly signed GIAs in the queue data over the past two-week period, a 142% increase compared to the prior two-week period. Most of these newly signed GIAs are clustered in the central U.S. (ERCOT and SPP) and mainly for solar and battery storage projects.
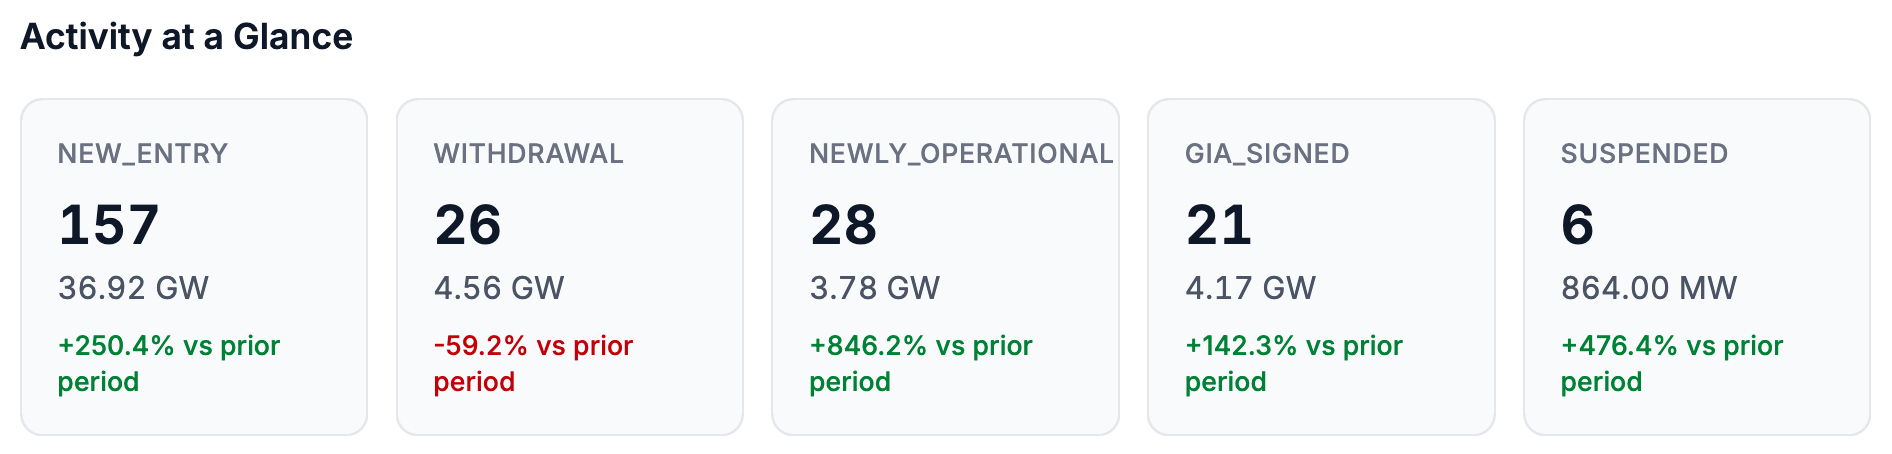
Activity at a Glance
The first two weeks of May have been a relatively active period for U.S. interconnection queues. 157 new projects totaling 36.92 GW entered the queues, a 250% jump from the prior two-week period. Only early April (50 GW added) saw more new queue capacity over the past six months.
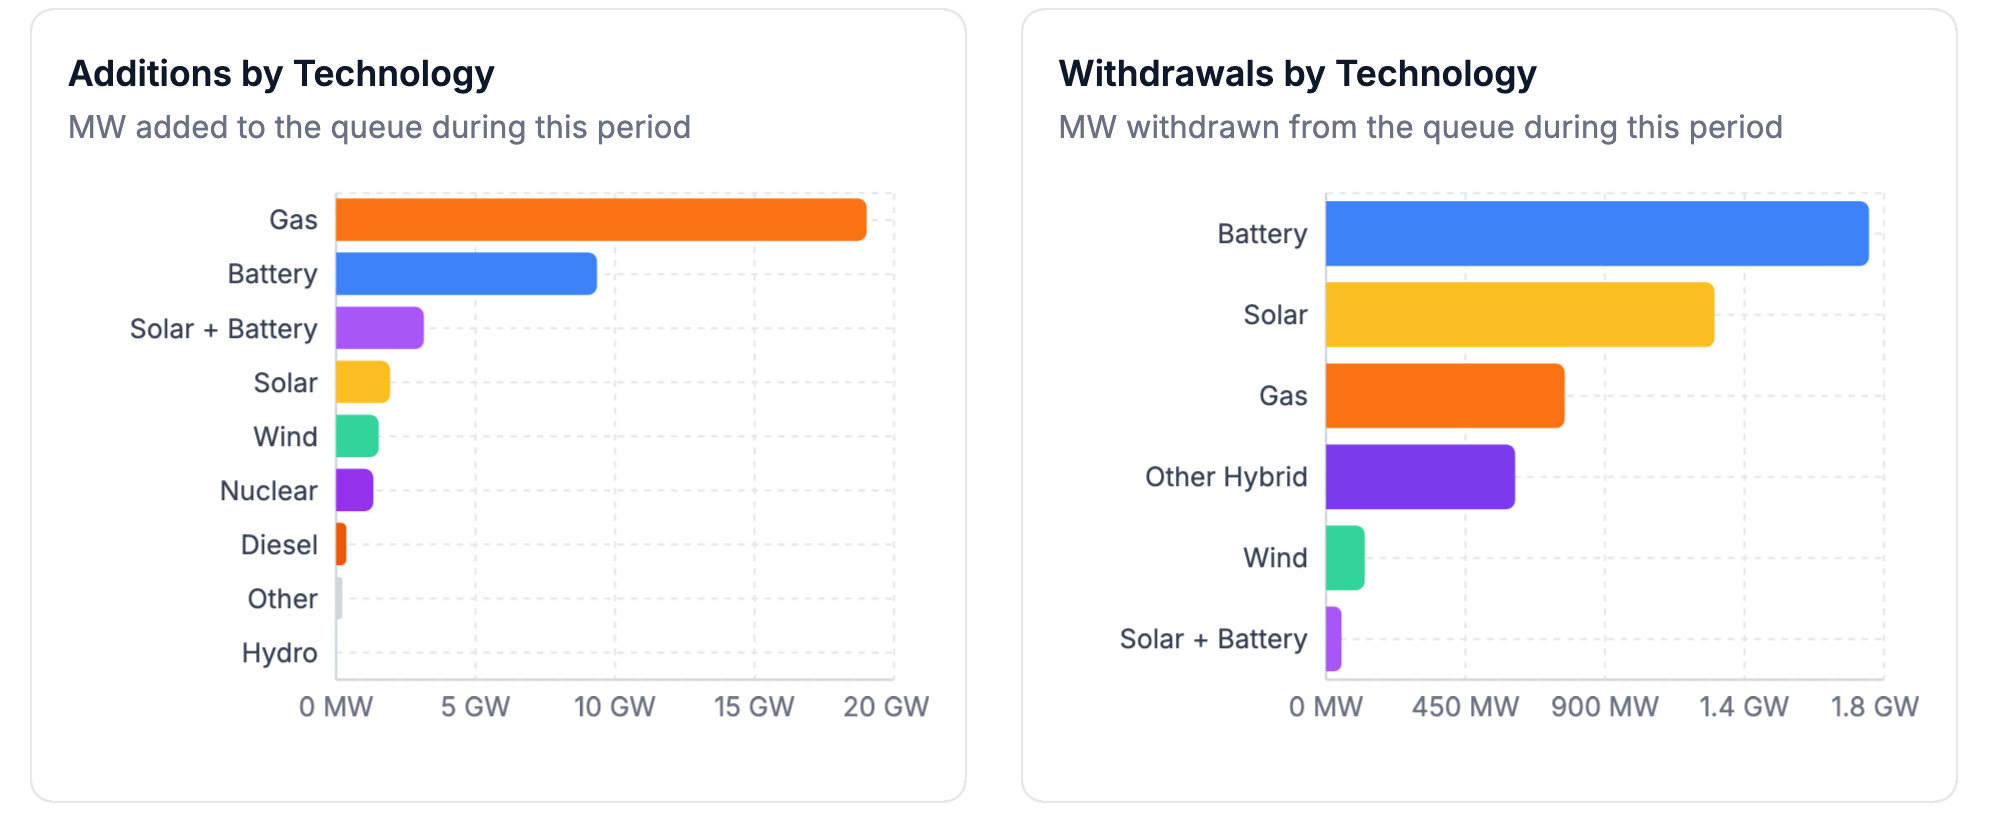
After years of surging requests from renewables (mainly solar and storage) we are now seeing gas rebound and continue to drive additions to the queue, accounting for more than half of all new capacity this period (~20 GW). Batteries (~10 GW) were the second largest contributor to the increase in queue capacity over the last two weeks.
Withdrawals were comparatively muted at 4.56 GW across 26 projects. The tech mix of withdrawals largely tracks the composition of the active queue. Battery storage and solar represent the largest shares of both currently active queue and recently withdrawn capacity. Six projects (864 MW total) suspended their queue request during this period.
Other parts of the queue ecosystem were active as well. 28 projects totaling 3.78 GW were reported as newly operational (up over 800% vs. the prior two-week period), and 21 projects (4.17 GW) appeared with newly signed GIAs (up 142%). Two-week snapshots of these metrics depend on utility and ISO data publication cadence, but the simultaneous uptick is a positive signal for project progression in 2026.
Queue Snapshot
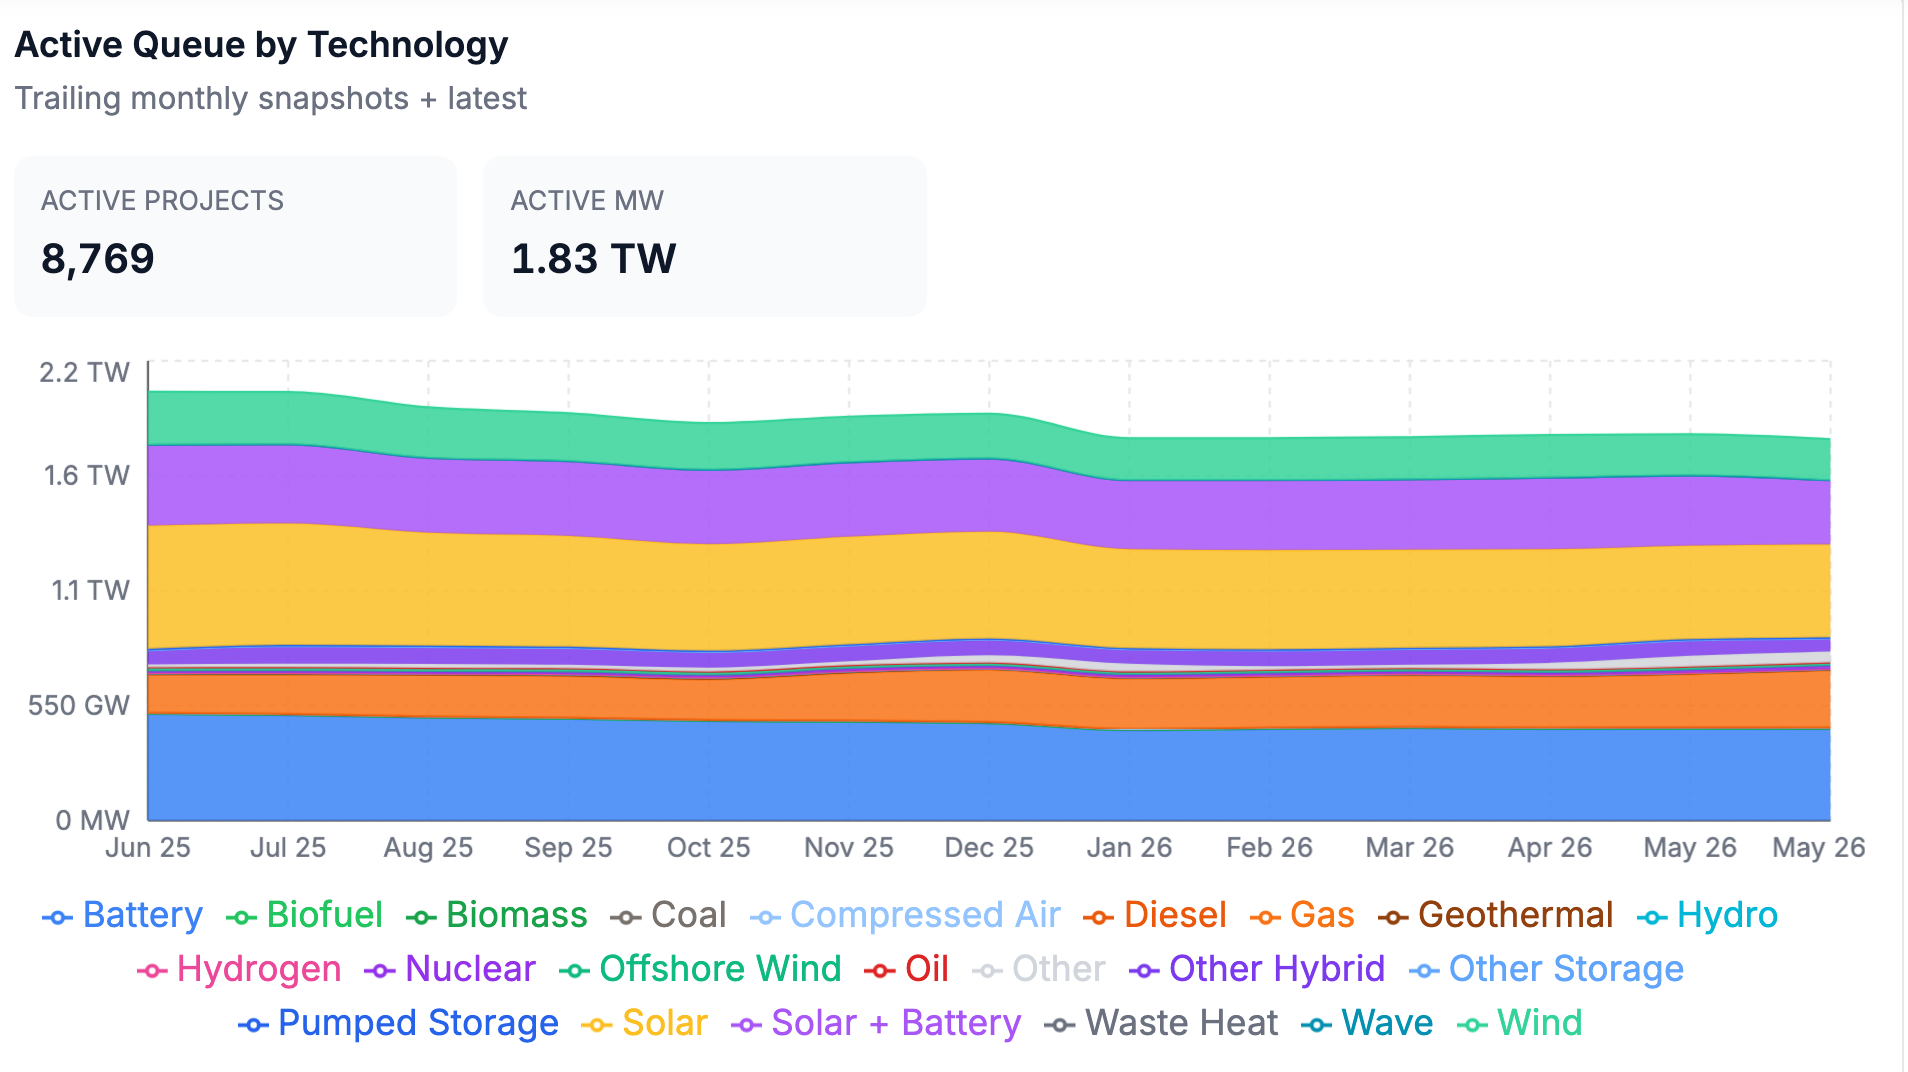
Overall U.S. queue capacity is continuing its multi-year contraction into early 2026. Active queue capacity now stands at 1.83 TW across 8,769 projects, down more than 200 GW from the end of 2025 (2.061 TW) and marking the second consecutive year of contraction following the 20–40% annual growth that defined 2019 to 2023. Two opposing YoY trends define the current state of the queues: the continued contraction of renewables and storage, and the rapid expansion of firm resources (mainly gas).
Every major renewable and storage category is down YoY. Solar fell 24% (now 446 GW), solar plus battery hybrids dropped 21% (305 GW), wind shed 22% (198 GW), and offshore wind contracted by 13% (16 GW). Storage, which had seen substantial growth through 2023, has also entered the contraction phase with active battery capacity down 14% YoY (437 GW).
On the firm side of the queue, the trend is flipped. Gas is up 50% YoY at 273 GW, consistent with the surge that dominated 2025 additions and continues to lead recent activity. Nuclear capacity in the queue is up 75% to 14 GW, likely reflecting expectations around data center load. Geothermal is up 114% (nearly 4 GW), and even diesel (+282%) and coal (+5%) are growing.
Regionally, the queue remains heavily concentrated in three markets: the non-CAISO West (~430 GW), ERCOT (~420 GW), and MISO (~350 GW). Together these three represent the bulk of total queued capacity. The Southeast (~160 GW), SPP (~170 GW), CAISO (~120 GW), and PJM (~120 GW) trail behind, though PJM’s recent cluster window (220 GW of new requests) will reshape regional totals once those projects are reflected in the queue data.
Regional Breakdown
The Southeast region added more new capacity over the last two weeks than every other market combined. 25.88 GW of new entries against just 470 MW of withdrawals yields +25.41 GW net for the region, driven almost entirely by gas projects in Southern Company service territory. ERCOT added another +6.02 GW net (6.50 GW in, 487 MW out), continuing the steady growth trajectory that has defined its queue since 2023. The West contributed +2.77 GW net. In the absence of new cluster window data (still no project-level details on PJM’s Cycle 1), all other markets saw net withdrawals, led by MISO at -1.23 GW. The remaining markets each saw less than 200 MW of net withdrawals.
The West has contracted from ~480 GW since last June, while ERCOT has held roughly steady. MISO, one of the busiest markets in 2025, has shed roughly 75 GW over the same window, working through the aftermath of its DPP 2022 and DPP 2023 cluster cycles. CAISO, PJM, Southeast, and SPP all hover in the 120–175 GW range while NYISO is down from ~45 GW to ~25 GW over the past year.
PJM’s recent reformed-process cluster window will reshape these rankings significantly. Once those 220 GW (811 projects) are reflected in queue data, PJM will jump from ~120 GW to roughly ~340 GW, putting it in line with MISO. We should start to see the new PJM requests reflected in the data in the coming weeks.
Notable Projects/Trends
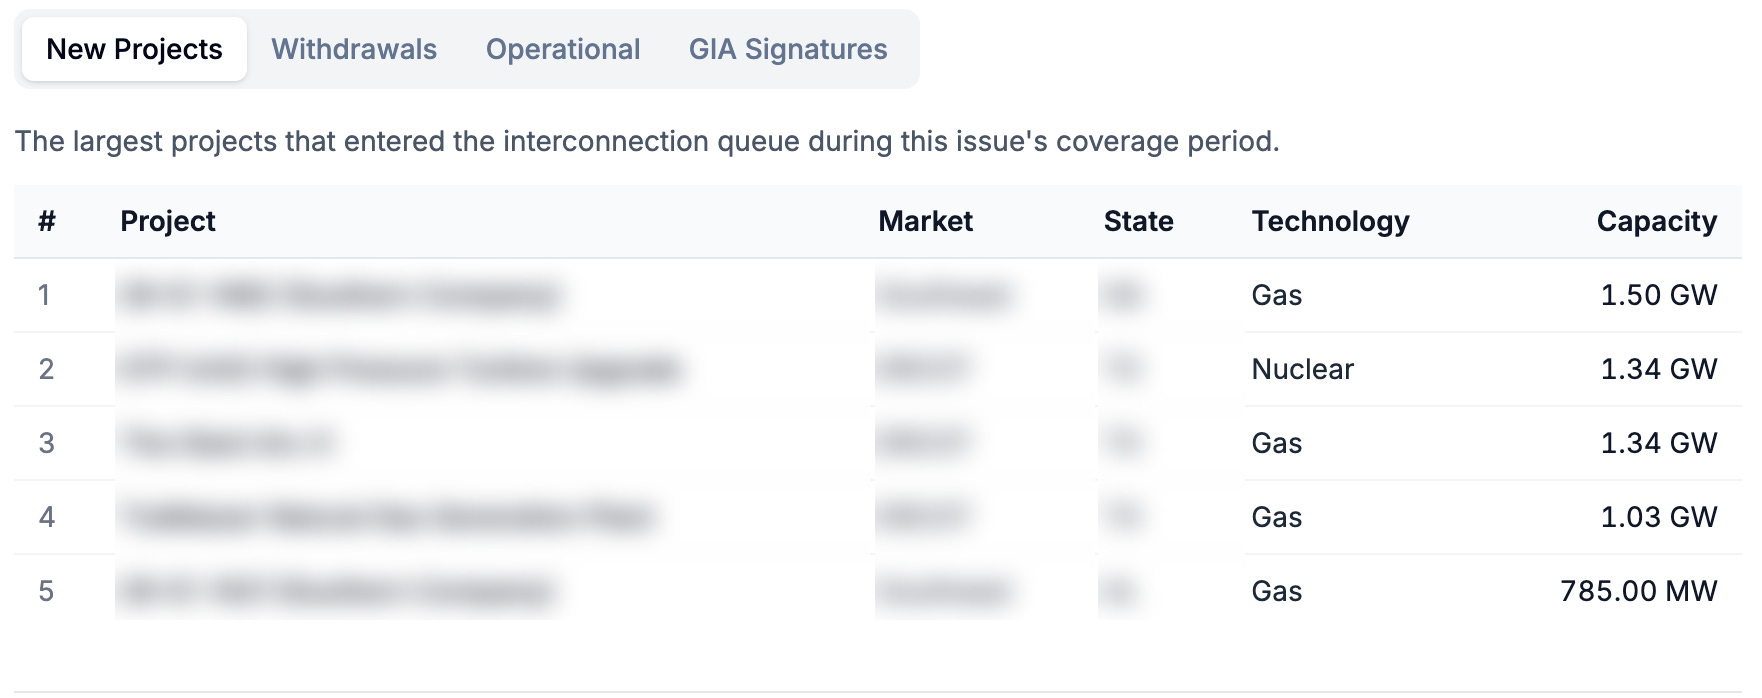
The largest new requests in this period reinforce the broader trend we have seen in queues over the last year or so. Gas is continuing to dominate additions, and over the last two weeks the largest prospective gas projects are coming from the Southeast and ERCOT.
Four of the five largest new requests are natural gas. Two are from Southern Company (1.50 GW and 785 MW) and ERCOT also added two projects greater than 1 GW. The volume of large gas projects in these regions is another sign of the firm capacity build out that has been gathering momentum throughout 2025 and 2026, likely driven by rising data center load growth and lower interconnection costs.
The Biggest Movers
Multiple new mega-projects entered the queues during this period. If you’re interested in following projects like these with real-time change alerts and deeper asset-level insights, reach out to us to learn more about GridTracker.
GridTracker users get access to:
Project-level insights (see the project-level changes that occur in real-time)
Exportable datasets (export the full list of newly operational, withdrawn, GIA-signed, and added projects)
Interactive graphs and visualizations
Custom dashboards with real-time alerts and data export
… and much more!
 | A guest post by
|
 | A guest post by
|
 | A guest post by
|