


Executive Summary
The following entities updated their queue data this period: NYISO, SPP, MISO, PJM, CAISO, ISO-NE, Arizona Public Service, Bonneville Power Administration, Duke Energy Progress, Idaho Power, Jacksonville Electric Authority, LADWP, PacifiCorp, Santee Cooper, SMUD, Tampa Electric, Tennessee Valley Authority, Tri-State Generation and Transmission.
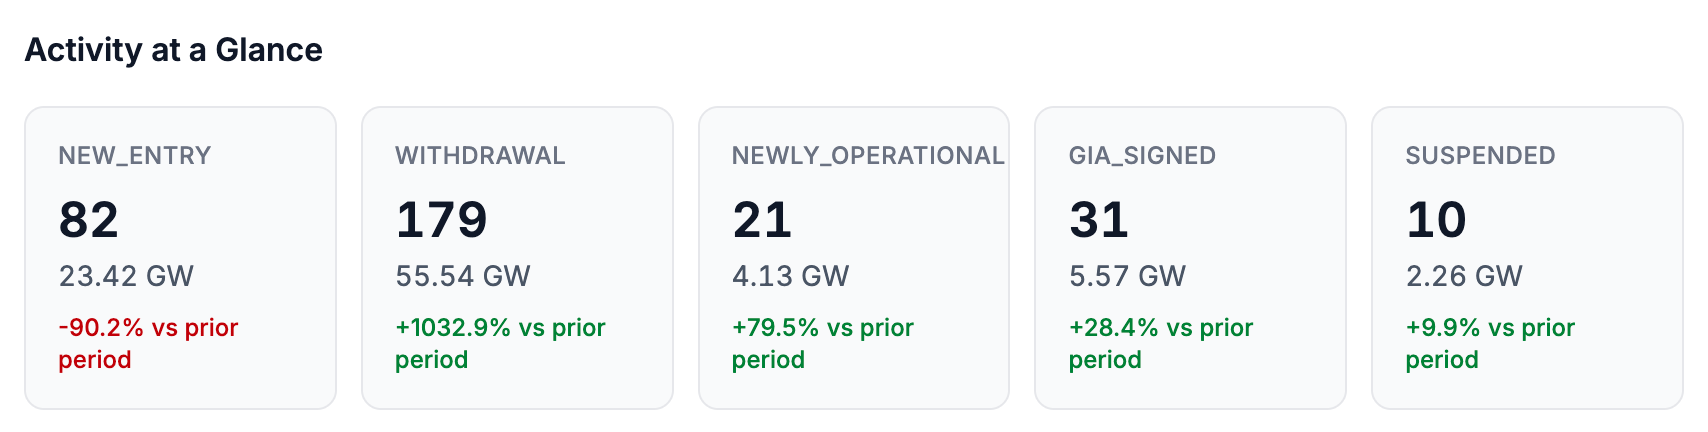
Additions: 23.4 GW (82 projects)
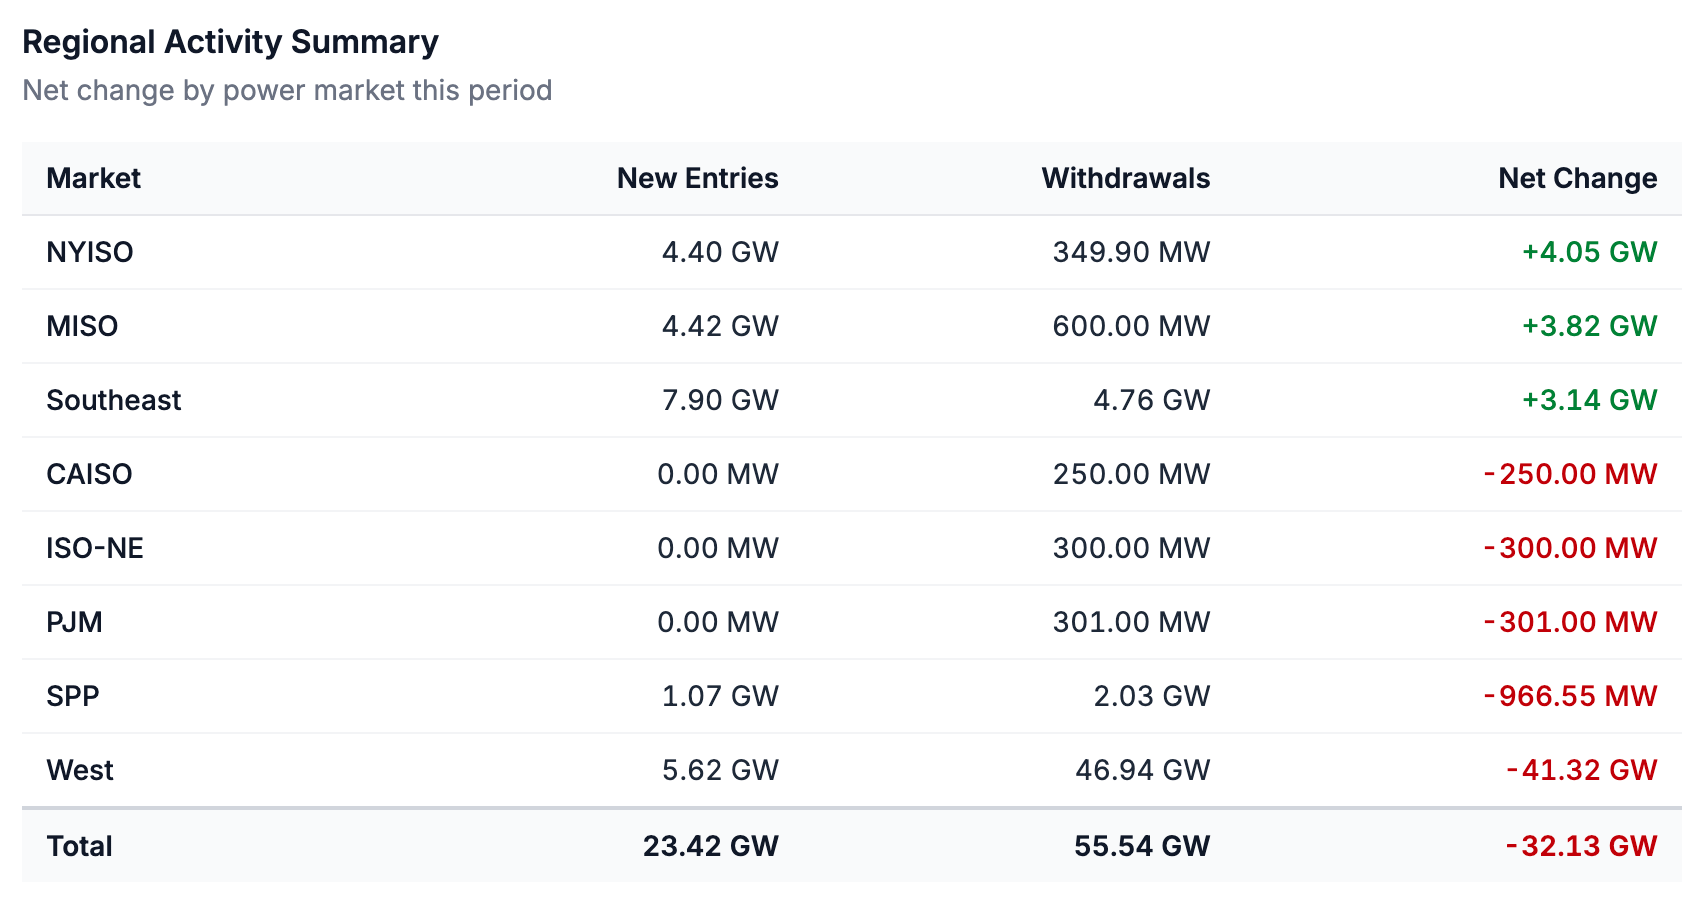
Southeast: 7.9 GW, the largest of any market. Tennessee Valley Authority (TVA) accounts for 6.9 GW across 9 requests.
West (non-ISO): 5.6 GW.
MISO: 4.4 GW, including five Expedited Resource Addition Study (ERAS) requests.
NYISO: 4.4 GW.
SPP: 1.0 GW.
By technology: gas 8.4 GW (36%), battery 4.4 GW (19%), and coal 3.3 GW (14%), with the remaining queue additions composed of mainly solar hybrids, wind, and standalone solar.
Gas and coal together were 50% of all new entries. Storage in some form was 30%.
Average project size: 286 MW.
Withdrawals: 55.5 GW (179 projects)
The non-ISO West accounts for roughly 85% (46.9 GW, 119 projects) of everything withdrawn.
Bonneville Power Administration (BPA) alone saw 24.7 GW of withdrawals across 58 projects.
LADWP: 14.8 GW across 27 projects.
Southeast: 4.8 GW across 34 projects.
SPP: 2.0 GW across 10, mainly from the DISIS-2024-001 cluster.
By technology: solar plus battery 18.72 GW, battery 16.53 GW, other hybrid configurations 6.26 GW, gas 5.91 GW, solar 4.07 GW, biofuel 1.44 GW, wind 1.07 GW, pumped storage 600 MW, compressed air 500 MW, hydrogen 346 MW.
By technology: storage configurations led withdrawals at 41.5 GW (75%). Gas (5.9 GW) and standalone solar (4.0 GW) make up the remainder.
Average project size 310 MW.
Other Activity:
31 projects executed GIAs totaling 5.6 GW.
21 projects (4.1 GW) reached commercial operation, with gas (2.4 GW) accounting for 58% of capacity coming online in the data.
In the News & On the Docket
All six grid operators answered FERC’s large load show cause orders on August 17. FERC issued the orders on June 18 and directed each RTO and ISO to demonstrate that its tariff appropriately handles the interconnection of large and co-located loads. CAISO circulated a large load straw proposal on August 12 that proposes defining a large load as “a new commercial or industrial customer, located at a single site behind one or more points of interconnection, and that has a peak load of 50 MW or greater, interconnects to the transmission system at a voltage level of greater than 69 kV, and is not part of a colocation arrangement.” The proposal also outlines two flexible interconnection service options, with a full FERC filing expected in November.
ERCOT Batch Zero. The Public Utility Commission of Texas discussed Governor Abbott’s directive to verify and audit all data centers advancing through ERCOT’s large load interconnection process. ERCOT has paused Batch Zero classification and study activity until that verification is complete, and it will not authorize data centers or other large loads to energize in the meantime. ERCOT is implementing the directive through two workstreams:
Batch Zero eligibility check, where ERCOT will ask developers with loads of 75 MW and above to produce documentation certifying their projects met the entry criteria.
ERCOT will also collect and report information from computational loads of 25 MW and above on grid and water usage, onsite generation, public financial assistance, ownership, and community impacts.
Activity Map
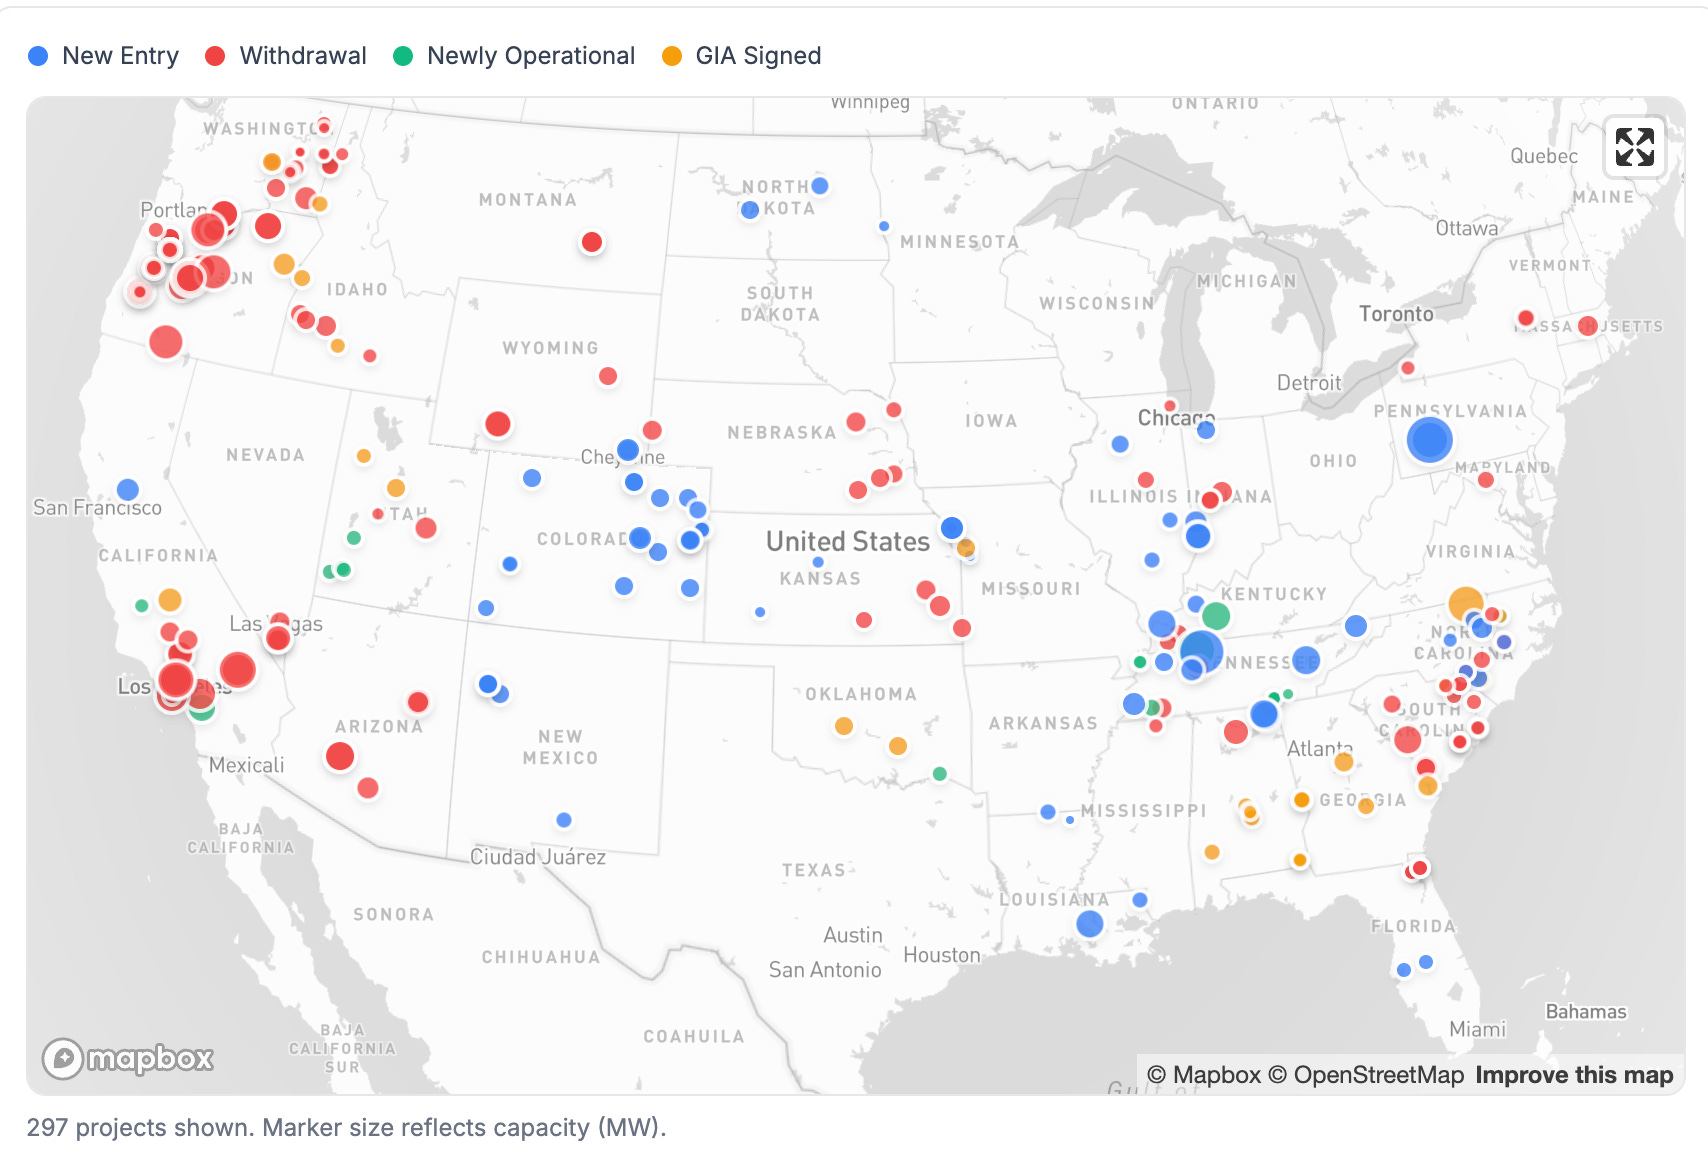
The majority of the queue activity this period comes in the form of withdrawals, concentrated in the Pacific Northwest and Southern California. BPA’s withdrawals (24.7 GW across 58 projects) in Oregon and Washington are all Transition Cluster projects added between September 2021 and November 2023. The California withdrawals are from LADWP and center in Los Angeles County (12 projects, 7.8 GW) and Kern County (7 projects, 2.0 GW), with an additional 2.3 GW across six projects on the Nevada side of its footprint in Clark County. Nearly all the withdrawn LADWP capacity is solar and storage. Solar+battery hybrids account for 8.8 GW (13 projects) and another 3.1 GW of standalone battery capacity withdrew. Elsewhere in the non-ISO West, 1.6 GW of gas withdrew from Arizona Public Service’s queue.
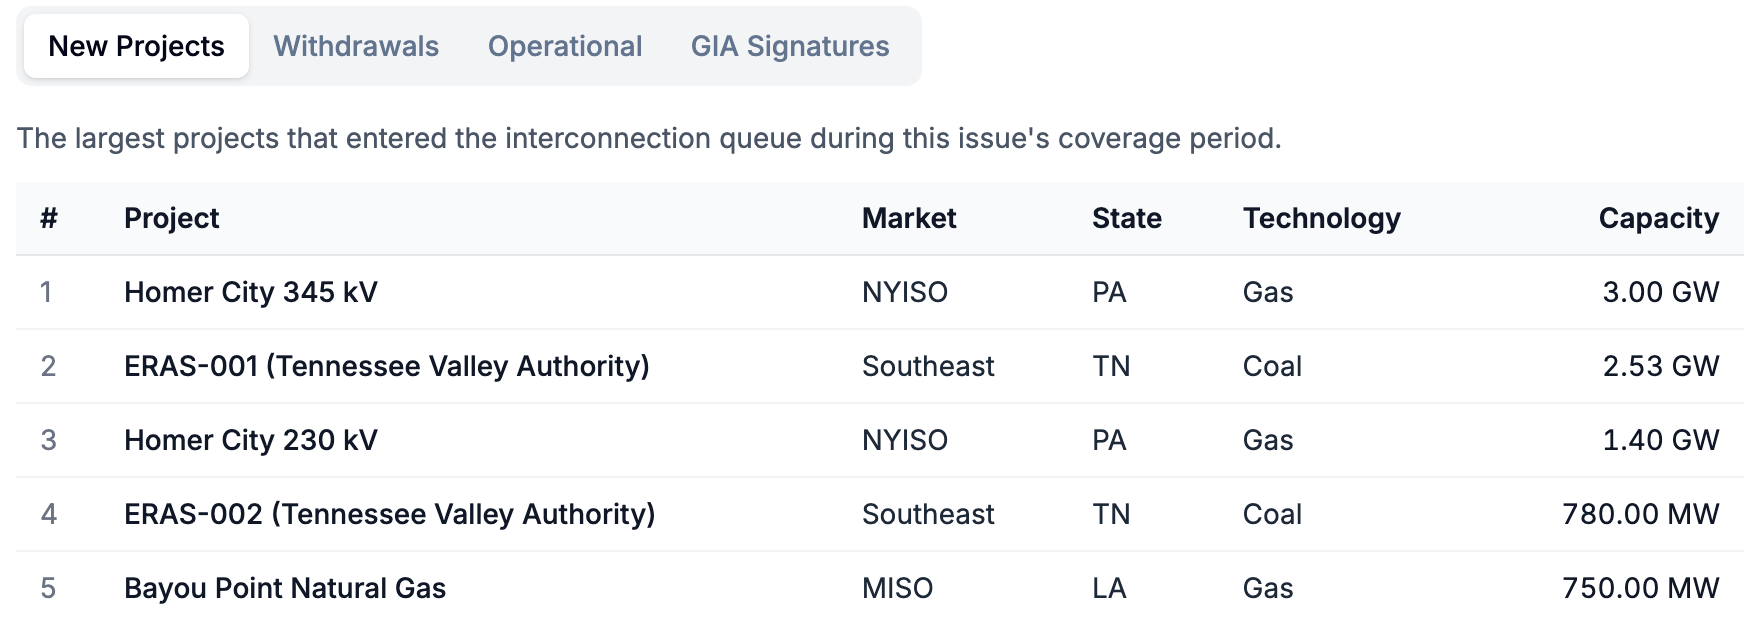
New queue requests are more evenly distributed this period. Colorado added 3.6 GW of new capacity via 21 Tri-State Generation and Transmission requests, part of a 28-request, 5.2 GW update that also extends into New Mexico and Wyoming. The bulk of other newly added capacity is spread across the Midwest, mid-South and Southeast. NYISO also added two requests in Homer City, PA totaling 4.4 GW, which we discuss in more detail below.
Projects recently executing GIA agreements cluster in Alabama, Georgia, and the Carolinas courtesy of Southern Company and Duke Energy progress. Southern Company accounts for 15 of the 31 agreements executed this period, twelve in Alabama and three in Georgia, totaling 1.5 GW. Duke Energy Progress accounts for four more totaling 1.7 GW across North and South Carolina. ERCOT, which usually updates its queue data regularly, is notably absent this period with no new additions or withdrawals.
Queue Activity
Last period, we saw a huge influx of new queue capacity, mainly coming from the first cycle of PJM’s newly reformed interconnection process. Over the last two weeks, new requests fell by 90% to just over 23 GW while withdrawals are up more than tenfold to 55.5 GW, resulting in a net reduction of 32.1 GW. While the capacity entering the queues over the past two weeks seems relatively small, especially compared to last period, it is within the normal range for a two-week period over the last 12 months, and is a function of the uneven cadence of ISO and utility queue data updates. On the other hand, the 55.5 GW of withdrawals this period is the second largest two-week total we’ve seen so far in 2026.
What is entering and exiting the queues continues to follow the pattern we have tracked all year. Gas represented over a third of newly added capacity, at 8.4 GW, while renewables and storage accounted for roughly 89% of withdrawn capacity this period. Storage in some form appears in 75.8% of withdrawn capacity, and solar paired with battery accounted for 18.7 GW of withdrawals, the highest of any technology. Standalone solar requests, by contrast, totaled 490.5 MW, the smallest figure we have recorded in recent periods. Gas and other firm resources are continuing to claim a larger share of the queue.
Queue Snapshot — Current State
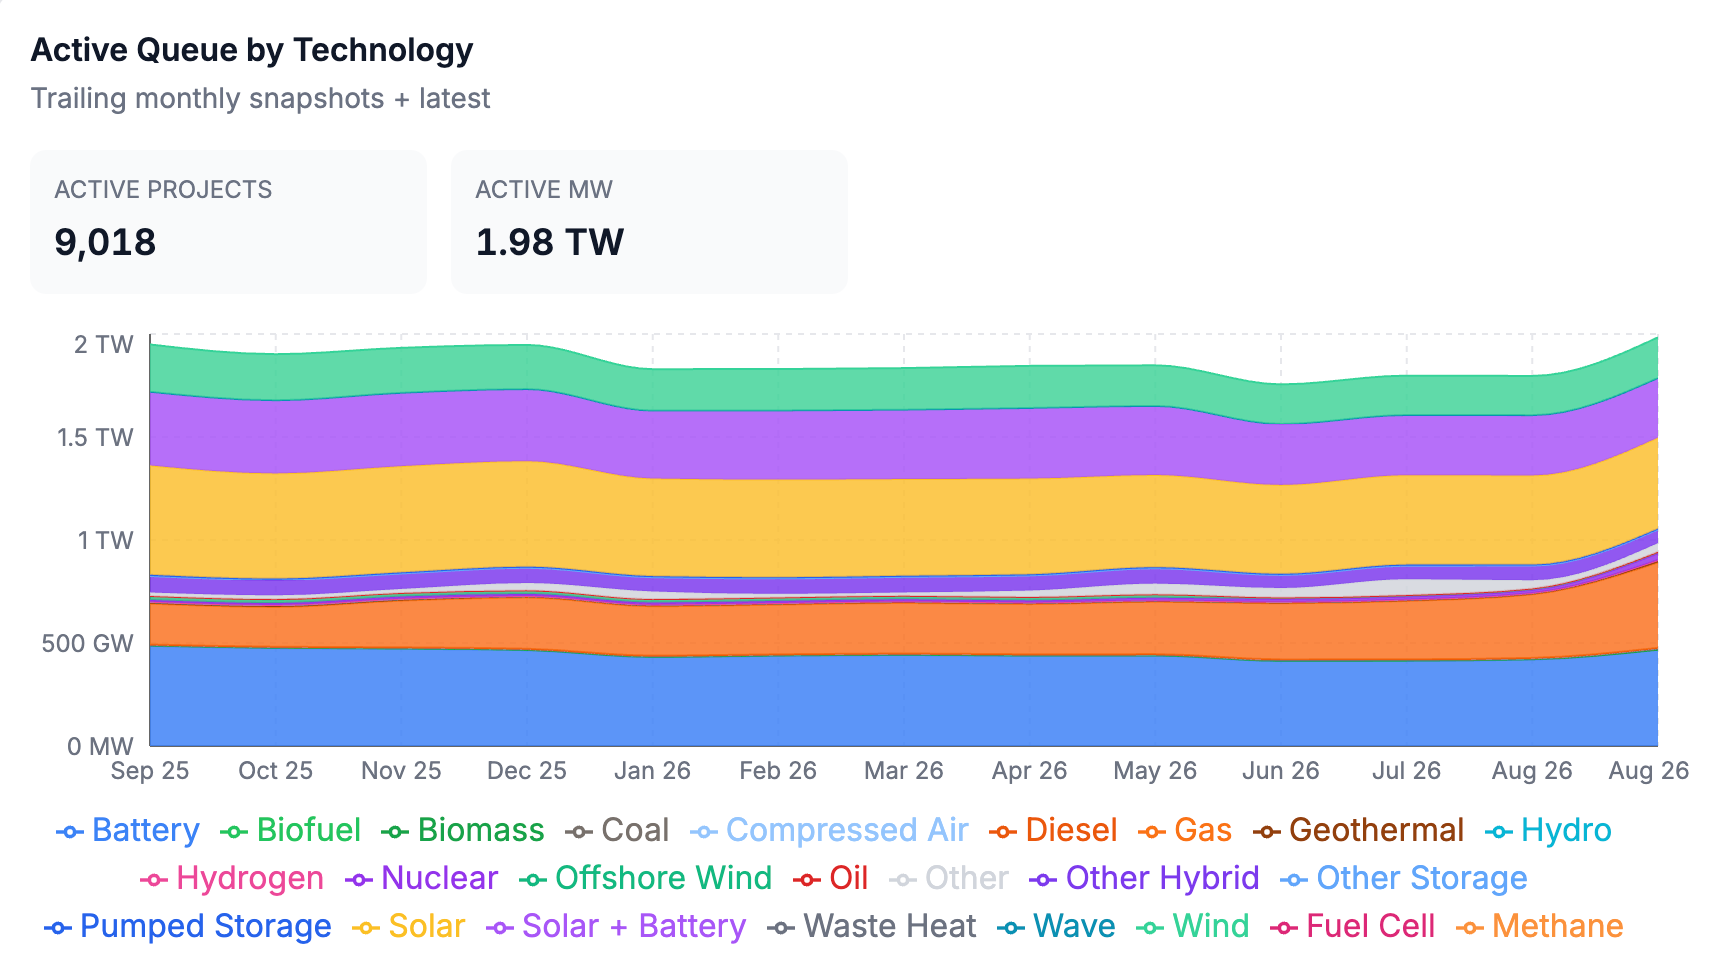
Active capacity stands at 1.98 TW across 9,018 projects, down from 2.01 TW across 9,068 projects last period. We flagged the 2 TW threshold last edition as a largely arbitrary but useful gut check on the size of the national queue and noted that PJM’s Cycle 1 additions had pushed the queue back above it for the first time in a while. This period, withdrawals pushed total active capacity back below 2 TW.
Five technologies still account for 91.4% of the queue, essentially unchanged from last edition: battery at 467.1 GW, solar at 441.6 GW, gas at 414.1 GW, solar+battery hybrids at 289.4 GW, and wind at 197.2 GW. The gap between solar and gas narrowed again, to 27.5 GW from roughly 33 GW last period. Gas added 1.85 GW net this period while solar shed 3.73 GW. If gas overtakes solar within 2026, it looks likelier to happen because renewables are withdrawing at a higher clip than gas capacity is being added.
Year-over-year, thermal resources continue to see the largest percentage gains. Gas is up 109%, with PJM accounting for roughly a quarter of the national gas queue at 109.1 GW, almost all of it from their recent Cycle 1 queue update. Nuclear is up over 200% to 32.5 GW, and PJM holds about 60% of that. Coal is up 120% to just over 7 GW. Renewables continue to move in the other direction, with solar down 17%, solar+battery down 19%, wind down 14%, and offshore wind down 63%. Battery is the most resilient technology in the queues, only down 3.9% and remains the single largest technology in the queue. Storage in some form now accounts for roughly 762 GW, or 38.5% of active capacity, down from roughly 786 GW last period.
Regional Breakdown by ISO/RTO
The non-ISO West shed 41.3 GW net, taking its active queue from 483.9 GW to 444.0 GW and dropping 87 projects in two weeks. With this decline in active capacity, ERCOT is closing in on becoming the largest queue in the country in terms of active capacity (just 3.7 GW behind the non-ISO West).
In the non-ISO west, BPA’s active queue fell from 71.6 GW across 245 projects last period to 47.0 GW across 189, a 34.3% reduction in capacity in two weeks. All 58 withdrawals are recorded as Transition Cluster projects. In LADWP, only three of its 27 withdrawals this period include withdrawal dates between August 8th and 21st. The remaining 24 range from February 25th through June 26th, which suggests this is a larger queue data update from LADWP as opposed to a set of recent withdrawal decisions. Fifteen of the projects that exited LADWP’s queue queue were recorded as withdrawn at the interconnection customer’s request and 12 were withdrawn by the transmission provider. Transmission provider-initiated withdrawals usually indicate a project didn’t meet queue process milestones or requirements rather than a business decision by the developers.
The Southeast added more new capacity than any other market at 7.9 GW, though it also shed more than any market outside the West, resulting in a net gain of 3.1 GW. TVA drove both sides, with nine new requests totaling 6.9 GW against six withdrawals totaling 1.5 GW. Three of the additions came through TVA’s Expedited Resource Addition Study (ERAS) process, and two of those are coal: the 2,529 MW Cumberland plant and the 780 MW at Kingston plant. Both appear to be continuations of existing plants rather than new construction, since the TVA board voted back in February to keep Kingston and Cumberland running past their scheduled retirement dates. The other six requests are new projects, including 1.5 GW of gas across two requests at the Bellefonte nuclear site in Alabama.
MISO posted a net increase of 3.8 GW stemming from five ERAS requests. All five cite incremental commercial load they intend to serve in the region. SPP posted a net reduction of 967 MW this period, with nine of its ten withdrawals coming from the DISIS-2024-001 cluster. The SPP DISIS-2024-001 cluster has now shed 63.2% of its capacity before reaching Phase 2 of the study process.
NYISO added 4.4 GW of new capacity this period from two new requests for the Homer City redevelopment project in Pennsylvania. Based on the queue data for these two projects, they appear to be affected system interconnection requests for which NYISO will study reliability impacts and allocate the cost of any resulting upgrades, but will not assess deliverability or confer interconnection service. The same redevelopment also has two queue requests in PJM’s Cycle 1 cluster totaling 2.5 GW, which makes the NYISO pair look like the New York side of a single Pennsylvania interconnection. The retired Homer City coal plant was directly connected to both the PJM and NYISO transmission systems, which is why requests appear in both queues, and we will dig into the relationship between the two sets of filings before treating the capacity as either duplicated or additive.
Notable Projects
Existing interconnection rights at decommissioned coal plants are becoming valuable assets. Homer City is a clear example, a retired Pennsylvania coal station now being redeveloped to deliver up to 4.4 GW to AI and high-performance computing data centers. In MISO, the Merom project in MISO, where two requests from different developers, a 642 MW gas plant and a 500 MW battery, are both at an Indiana coal plant, and highlight how existing interconnection rights are proving to be a viable pathway for circumventing queue delays and upgrade costs.
The two largest projects reaching commercial operation this period were gas plants that entered the queue in 2020 and 2021, and represent more than half of all new operational capacity. The largest non-thermal project to come online is a 680 MW battery in Riverside County that entered the CAISO queue in April 2019 and reached operation in June 2025, a 6.2. The queue is shedding storage and renewable capacity faster than it is adding anything, while the capacity converting into steel in the ground is firm and was requested years ago.
Every withdrawal at or above 1 GW this period is a battery or battery hybrid in the non-ISO West. Five of those are 1.3 GW BPA requests that entered the queue on the same day in November 2023. Two of the projects requested service at the La Pine 230 kV substation and withdrew together. BPA does not publish developer names in its queue data, so we cannot confirm common ownership, but identical capacity at a shared point of interconnection with a shared queue date is consistent with a developer submitting multiple requests for different configurations of one project rather than distinct developments.
The two largest projects reaching commercial operation this period were gas plants that entered the queue in 2020 and 2021, and represent more than half of all new operational capacity added this period. The largest non-thermal project to come online is a 680 MW battery in Riverside County that entered the CAISO queue in April 2019 and reached operation in June 2025 (a 6.2 year queue duration). This appears to be more evidence that the queue is shedding renewable and battery storage capacity while what is being added to the queues and coming online is gas.
In terms of time to reach an agreement or interconnection, Duke Energy Progress executed an agreement on a 1,455 MW gas project in Person County, North Carolina, roughly 2.17 years after it entered the queue, which is one of the shortest durations from request to GIA we’ve observed all year and far quicker than the multi-year timelines we typically see.
Want to go deeper? GridTracker users get access to:
Project-level insights (see the project-level changes that occur in real-time)
Exportable datasets (export the full list of newly operational, withdrawn, GIA-signed, and added projects)
Interactive graphs and visualizations
Custom dashboards with real-time alerts and data export
Exclusive in-depth industry reports
… and much more!
Great digest, thank you.